

Too Busy? Got Better Things to Do? Read the Summary…
Germany leading the way?: Merz’s fiscal reform ignited a dramatic rally in German equities early last year, led by rearmament plays like Rheinmetall, but the trade has since faded through war fatigue and a coalition now polling Merz at just 14% approval. A softer European inflation outlook, and central bank policy less hawkish than the Fed’s, could still favour a rebound, but deep structural problems (a thin tech sector, weak demographics, fragmented fiscal policy, energy dependence and rising populism) remain real obstacles.
Ukraine news fatigue?: Eclipsed by the Iran conflict, the Russia-Ukraine war is intensifying again as Kyiv’s drone strikes hit major Russian oil infrastructure, raising the risk of escalation and even nuclear brinkmanship from Moscow. The EU has cut its reliance on Russian gas from more than half to around 15%, meaning the immediate market impact runs through oil rather than gas, at least for now.
Inflation and the stock market, objectively: Two centuries of data show inflation’s relationship with equities is not fixed: it depends on whether price pressure comes from demand or supply, and how aggressively the Fed reacts. Moderate inflation under 3% has typically been absorbed by markets, while sharper moves tend to come from the policy response rather than the inflation print itself, and persistent inflation is pushing stock and bond correlations higher, eroding traditional diversification benefits.
Bessent and Bonds: Treasury Secretary Bessent’s move to boost long bond buybacks eased yields for barely a day before the $40 trillion debt milestone and rising oil prices pushed the 10-year yield back to 4.69% and the 30-year above 5%. With fiscal deficits, oil-driven inflation and heavy AI-related corporate borrowing all in play, analysts see the intervention as only a short-term fix.
US Inflation, the new normal: FOMC minutes showed the Fed holding rates at 3.50% to 3.75%, with three regional presidents dissenting in favour of a hike and hawkish sentiment persisting even as core CPI surprised to the downside. Earnings growth is broadening well beyond the Magnificent Seven, with overall S&P 500 profit growth accelerating to 34%, though heavy AI capex is straining free cash flow and non-tech companies have yet to show much margin benefit from it.What Return Assumption Should You Use in Your Retirement Income Plan?: A Monte Carlo-based calibration table shows that real return assumptions above 4.5% sharply cut the odds of a 30-year retirement plan succeeding: 4% real implies roughly 85% success, while 6% real drops to about 34%. Because volatility taxes withdrawal rates in ways a straight-line spreadsheet cannot capture, a real return assumption of 3% to 4%, paired with genuine spending flexibility, offers the most sensible planning range.

The rand traded in a range of about R16.00 to R16.97 to the US dollar during the week; Brent crude rose to around $93.78 a barrel on 20 August, up from about $87 a week earlier, on renewed Strait of Hormuz tensions; gold traded near $4,466 an ounce, up about 2.65% on the week; and Bitcoin surged past $75,500, its highest level in more than three months.

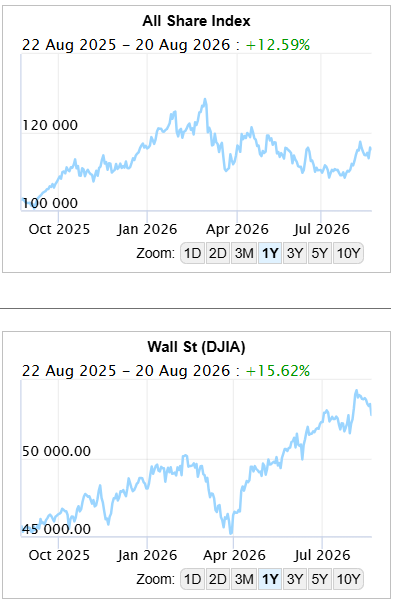
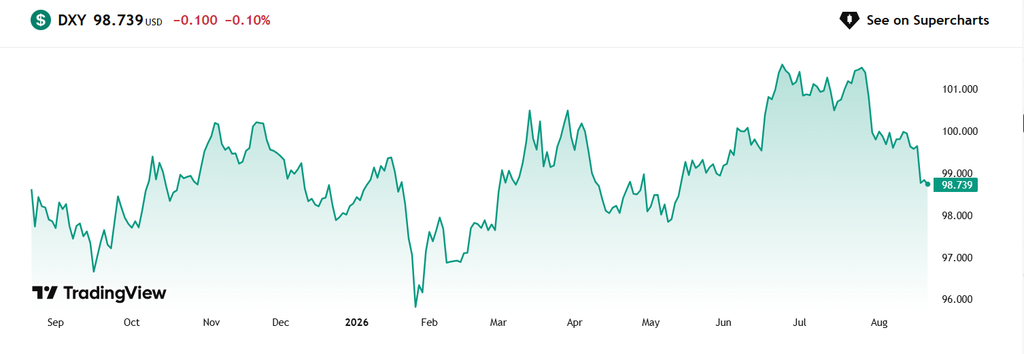



Is it worth exploring Europe again, particularly Germany? Early last year, the continent was rocked by dramatic shifts as leaders grasped that they could no longer rely on the US under President Donald Trump to take their side. In particular, Vice President JD Vance’s speech to the Munich Security Conference shocked his listeners.
When Germany chose a new chancellor, Friedrich Merz, after knife-edge elections a few days later, he launched a fiscal reform that hit like an economic earthquake. Constitutional limits on borrowing introduced after the Global Financial Crisis were repealed, and Merz instead announced a massive new rearmament campaign, something that had been taboo in Germany for decades (we have seen the same in Japan).
The market response was extraordinary.
Over the first three months of last year, MSCI’s Germany index outperformed the US by almost 40%. Since then, it has been one long, drawn-out letdown, with the outbreak of war in Iran puncturing the last resurgence by German stocks. Merz’s coalition is now in serious trouble, while his approval rating has plummeted to 14%.
But now, there might just be another chance to get in on the excitement. The star of the rearmament fervour was Rheinmetall AG, the biggest German weapons contractor. Its performance in the wake of the twin US and German political shocks dwarfed even the greatest beneficiaries of the artificial intelligence boom. It peaked earlier this year and endured a long slide, which may now be coming to an end:
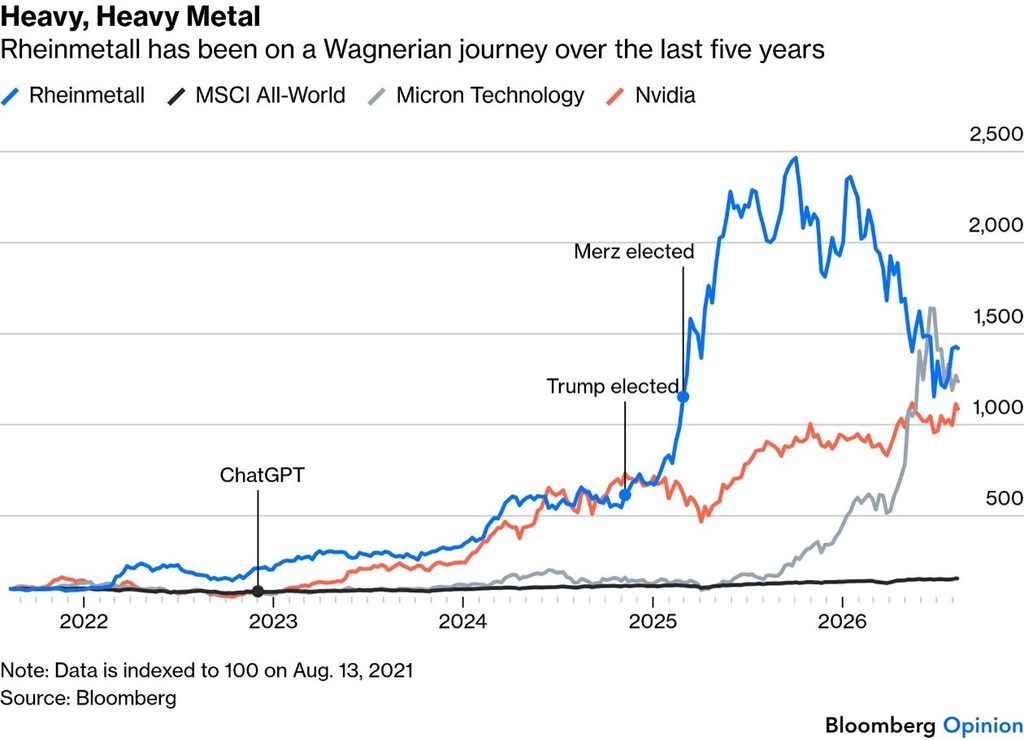
European companies have a decent chance of closing this gap. Inflation seems to be less of a problem than in the US, and further hikes from the European Central Bank are now seen as less likely than from the Federal Reserve. All else equal, that should help Europe’s manufacturers, which also stand to benefit from rising German spending.
None of this corrects for some deep-seated problems. The list of ongoing bear points that might deter investors is formidable:
European stocks are cheaper than the US for valid reasons. But while nobody has been paying attention, the continent has made steps in the right direction, and geopolitical uncertainty hits it more than the US. If that uncertainty is resolved, Europe stands to benefit disproportionately. But that’s a big if…

The Russia-Ukraine war is now in its fifth year. It has been almost totally eclipsed in market attention by the five-month-old Iran conflict, but it’s emerging from a stalemate amid intensifying aerial attacks from both sides. Investors need to pay attention.
For all the human costs of the war in Eastern Europe, these attacks are overshadowed for investors by the intractable drama over the Strait of Hormuz, the critical transit point for roughly a fifth of global crude oil exports. Tracking news stories across the Bloomberg Terminal that mention Iran or Ukraine offers a useful proxy in comparing the attention both conflicts are getting.
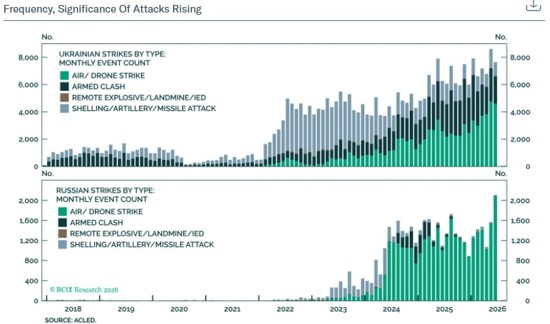
Interest in the Ukraine conflict died down after six months, and has trended lower ever since. But Kyiv’s onslaught on critical oil infrastructure in Russia, largely using drones, is beginning to weigh on output. That raises the possibility of the war progressing beyond the current stalemate.
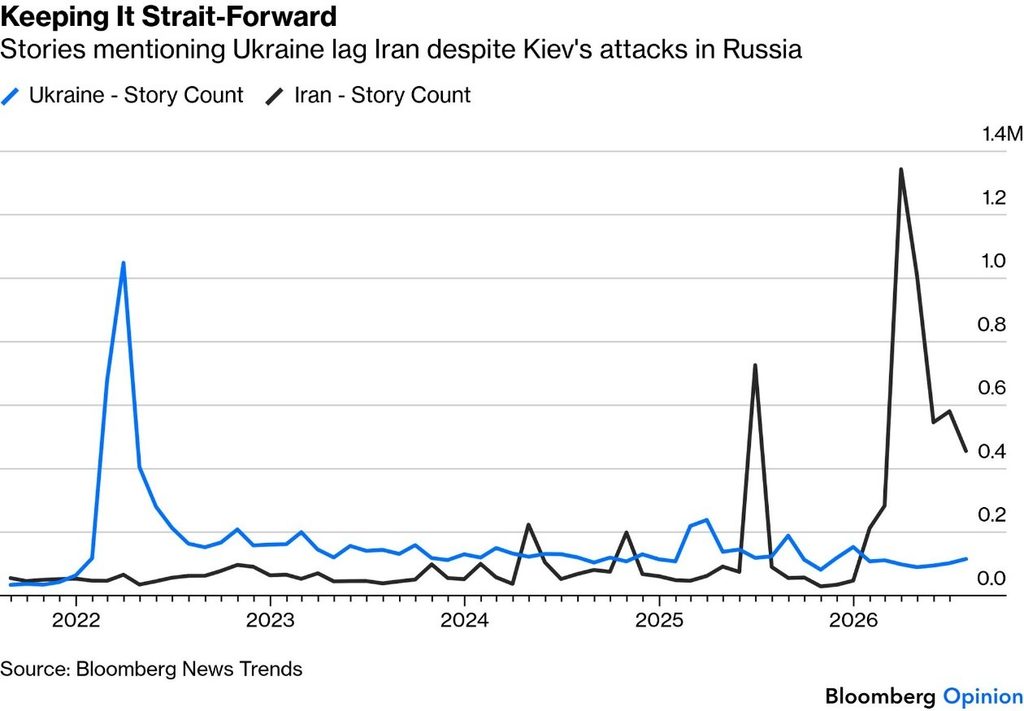
Following the recent strike on Russia’s largest oil refinery complex in Tatarstan, with a capacity of more than 300,000 barrels per day, it’s worth asking how much pain Ukraine can inflict and what spillover effects it has on broader energy markets.
Russia is redoubling its attacks on Ukraine and has made a series of provocations against NATO. It wouldn’t be surprising if the Kremlin were to resort to nuclear brinkmanship, perhaps on the greatest scale since the Cold War, over the next 12 months.
A new fear factor is likely to hit financial markets in the coming weeks and months, despite the perceived de-escalation of geopolitical risk due to US-Iran diplomacy. It may not dissipate until the US has staged a show of solidarity along with NATO to deter Russia from the path of conventional war, which may take half a year or more (or until 2028? Trump is well-known for preferring Putin over Zelensky).
Whether economic tensions rise further depends on fundamentals, with Gas front and centre. Bloomberg Economics estimates that Russia accounted for more than half of EU gas imports in 2021. But the EU policy to free itself from Moscow’s stranglehold has brought that share down to about 15%, with the bloc on track to phase out Russian imports entirely next year. (Some such resolution presumably lies ahead for the Strait of Hormuz.) The latest jump in gas prices has probably not been driven by Ukraine, whose attacks so far have targeted oil refineries rather than gas pipelines or Russia’s Arctic LNG terminals, which are well beyond its reach. The Strait of Hormuz remains the more potent driver.

Inflation and the stock market – objectively
The relationship between inflation and equity markets is far less predictable than conventional wisdom suggests.
Academic work spanning two centuries of US data shows the correlation between stock prices and inflation is not fixed: it has flipped between positive and negative across different historical periods, turning up in the 1840s, 1860s, 1930s and again in 2011, while running negative through most other stretches.
More recent research covering January 2015 through June 2025 reinforces this instability, finding that inflation and rate increases tend to weigh on stock returns, but only after a lag, while GDP growth supports returns more immediately.
The takeaway for investors is that inflation’s effect on equities is regime dependent, shaped by whether price pressure stems from demand strength or supply constraints, and by how aggressively the Fed responds.
This regime dependence played out clearly in the last five years.
The S&P 500 climbed roughly 81% between 2020 and 2025 while consumer prices rose about 23% over the same period, yet 2022 alone saw an 18% market decline as inflation hit 9%. Research into this period points to two separate mechanisms at work. First, when inflation stays moderate, below roughly 3%, equities have historically outpaced it in most periods, since companies can pass rising costs through to revenue. Second, when inflation runs hot, the Fed’s policy response, not the inflation print itself, tends to drive the sharper market moves, as rate hikes reprice future cash flows downward.
Growth and technology names are typically hit hardest in this scenario, while sectors selling everyday necessities, energy, food, and healthcare tend to hold up better.
Higher and more persistent inflation tends to push stock and bond correlations higher as well, reducing the diversification benefit that a traditional 60/40 portfolio has historically relied on.
Rolling three-year stock/bond correlations sat close to zero or negative through most of the 2000 to 2020 period, but turned positive as inflation resurged from 2021 onward.
With core inflation still running above the Fed’s 2% target and current forecasts pointing to it staying near 3% through the end of 2026, expect this closer stock/bond linkage to persist for now.

Treasury Secretary Scott Bessent’s latest effort to control yields on long-dated U.S. bonds was short-circuited after just one day, as the U.S. national debt hit the $40 trillion mark and oil prices rose as a result of the Iran war. Perhaps it’s because he has been spread too thin by his Uber-Lord; either way, Mr Bessent is proving to be a real disappointment.
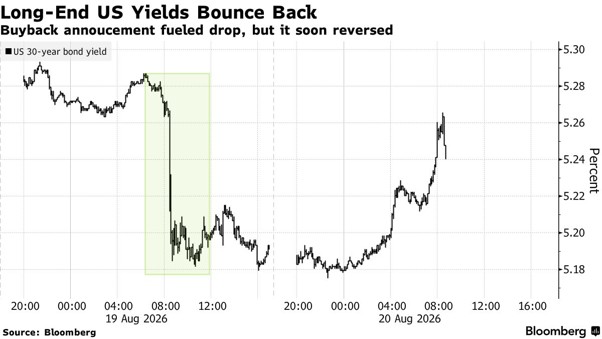
The 10-year Treasury yield jumped 5 basis points to 4.69% Thursday, giving back its retreat seen Wednesday after the Treasury Department said it would be increase its purchases of long-dated U.S. government bonds in September.
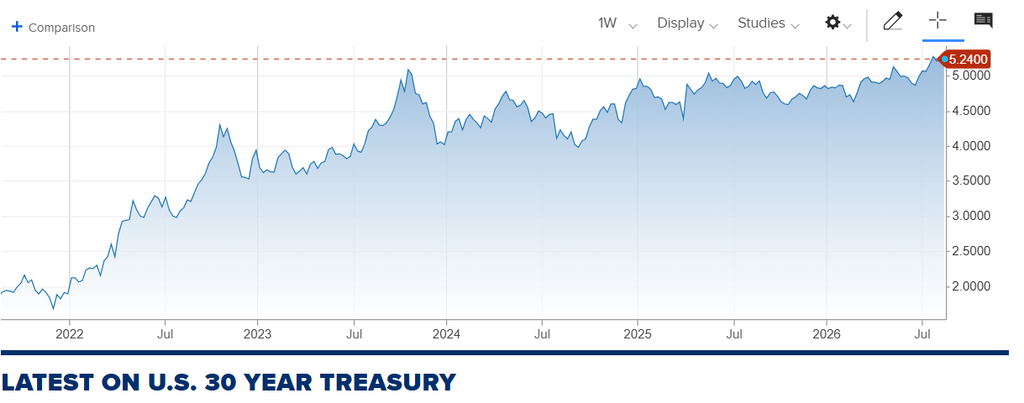
Yields on the long end of the Treasury curve briefly pared their earlier gains after Bessent appeared on CNBC Thursday, promising that the (pants on fire) White House would soon take a look at spending and insisting that budget deficits would shrink. The Treasury Department declined to comment beyond Bessent’s statements.
The easing was short-lived. The 10-year yield has been hovering around its highest levels of the last two decades, while the 30-year Treasury yield has jumped above 5% and hit 2007 levels this week.
What can’t be ignored is the move in oil.
Brent crude price climbed above $93 a barrel on Thursday — up from below $70 in early July, with no end to the Iran conflict in sight.
Yields have drifted higher along with oil prices over the course of the Iran war, now in its sixth month. The conflict has pushed up energy and gas prices for U.S. consumers, stoked inflation worries and spurred President Donald Trump to ask Congress for billions of dollars to support the war.
The Trump administration has been vocal about wanting to keep 10-year yields lower to help with the U.S. affordability crisis (hint, perhaps end the war-that-nobody-asked-for?) Managing the makeup of the roughly $31 trillion Treasury market has been one of the tools it has deployed to achieve that goal.
The artificial-intelligence build-out is also pressuring financing costs higher along with uncertainty about inflation and the U.S. fiscal picture.
Bessent probably felt it was time to draw a line in the sand and not let yields run further untethered. But on Thursday, traders were again demanding greater compensation for holding long-dated U.S. government debt.
This comes as investors have been pouring money into other asset classes. Investors were bracing for a potential $200 billion deluge of new corporate bonds to be issued in September, including from the tech hyperscalers funding the AI data-centre boom.
“We are trying to keep the market in equilibrium,” Bessent said Thursday, flagging the coming supply of corporate debt issuance.
Bessent posited that hyperscalers seem “almost yield-agnostic,” given the returns they expect on the AI build-out. “They don’t really care what they are paying.”
Yet with Treasuries struggling since 2022 and the U.S. national debt growing, some investors have begun to question whether they should ditch some bonds in their portfolios in favour of other asset classes like gold, which has rallied this week.
Congress has little motivation to cut spending (which could come to a grinding halt aafter the mid-terms), and the Fed is hawkish but still tolerating higher inflation.
Investors growing more confident the Federal Reserve will likely leave interest rates steady would be better off buying shorter-dated debt, which is more sensitive to expectations about monetary policy.
With inflation on track to remain above the Fed’s 2% target for a fifth straight year in 2026, either the labour market or the pace of U.S. economic growth would likely need to weaken to drag yields on the 30-year bond lower in the near term.
It has been kind of a perfect storm for bonds and maybe rightly so, with this supply picture and the inflation potential from the geopolitical situation, as well as all this Fed uncertainty. At the same time, yields are more attractive than they have been in decades, offering new buyers the opportunity to lock in higher coupon payments. Bessent’s latest intervention betrayed Washington’s growing unease with elevated borrowing costs, though analysts warned that his plan risks being only a (very) short-term fix. Concerns remain in the market about outsized fiscal deficits, oil-induced inflation and broader supply pressure from the AI industry’s borrowing binge.

The Federal Reserve released the minutes of the July 28-29 FOMC meeting on Wednesday, which is interesting given Warsh’s new uncommunicative stance (no news is good news?).
Key details:
However, the market still remains braced for a couple of hikes to come through eventually, largely because of inflation. Successive shocks from tariffs and the Iran war, plus price rises after the post-pandemic surge, have left inflation above target, and opinions remain widely dispersed.
The next moves from the Federal Reserve, which has kept short-term target rates on hold all year, and from longer-term Treasury yields, which have been steadily rising and threatening to break out into new post-crisis highs, depend on inflation.
Core CPI was startlingly low in June, less than even the lowest estimate in Bloomberg’s survey of economists, this continued in July. The expectation now is that this will continue and further ease the pressure for rate hikes, but there will be relief when and if this is confirmed.
The balance of comments by senior officials since the last Federal Open Market Committee meeting has been hawkish, with Cleveland Fed President Beth Hammack saying Monday that “some number” of rate hikes may be needed. So further falls toward the 2% inflation target would be helpful.
Despite optimism about consumer prices, signs of pressure are in the pipeline. Raw materials prices are increasing, and not just oil. The Commodity Research Board’s RIND (Raw Industrials) index, which covers industrial products that aren’t quoted on futures markets, is rising sharply, as is Bloomberg’s index of the major industrial metals.
One of the greatest issues facing the Fed comes from the stock market. Earnings are climbing at a rate that in the past has virtually ensured rising 10-year Treasury yields.
The stock market is similarly positioned for higher inflation. To some extent, it is natural that big increases in earnings and revenues (of which more later) likely mean an expanding economic cycle, bringing price rises with it.
Of late, cyclical stocks have dominated the market and tend to be positively correlated with inflation.
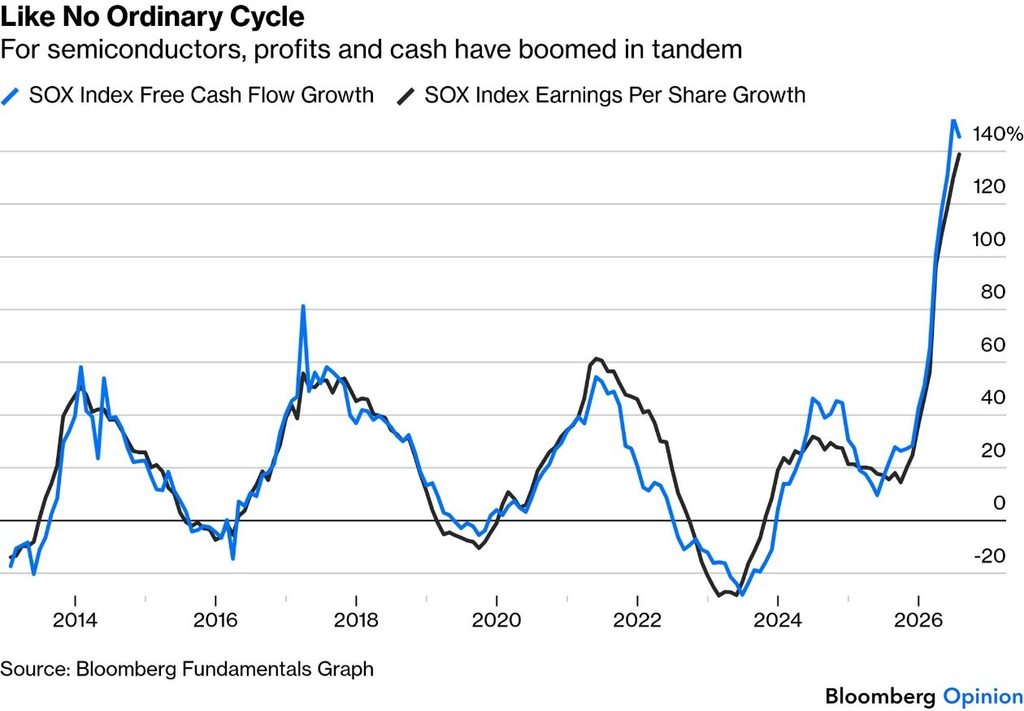
It’s certainly hard to argue that monetary policy is at present restricting the corporate sector. Another spotless inflation report would alleviate some concerns but the evidence from second-quarter earnings is still quite startling.
If earnings growth has been a party dominated exclusively by Big Tech, the guest list expanded in the second quarter.
Nearly everyone else is joining in as tech giants relinquish their advantage. With all S&P 500 companies now having reported their earnings, non-technology groups are on course for their second-best quarter since the debut of ChatGPT in late 2022, though they’re still far behind the remarkable overall earnings growth recorded by the Magnificent Seven leading the artificial intelligence buildout.
This is quite unmistakably a huge cyclical boom.
Overall S&P 500 profits growth accelerated to 34%, from 25% in the first quarter, one of the highest figures ever outside of recoveries from recessions. All sectors are on track to deliver growth, with seven of the 11 in double digits. While tech is still the lead driver, its contribution to aggregate growth is “only” 55% from about 90% a year ago.
Questions are mounting over how quickly the capex ploughing into AI will translate into profitability, but tech’s earnings growth is still impressive; it’s just that the cost of that investment is increasingly hard to ignore. Their free cash flow is deteriorating at an unprecedented pace as spending on data centres gobbles it up, even as the rest of the corporate sector generates more cash.
Semiconductor groups, meanwhile, are more concerned about what happens when that spending eventually slows.
Chipmakers have been the biggest beneficiaries of the AI buildout, with earnings and free cash flow rising speedily and in line with each other. The sector has always been cyclical (above), which makes it difficult to know how much longer the upswing can last. Any reversal could be substantial, depending on whether tech groups decided to pull back on their investments.
Even if earnings are broadening, non-tech companies’ profit margins show little evidence that they’ve yet managed to use AI to make themselves more profitable.
Nearly 90% of S&P 500 companies reported increased sales. The number improving their margins, however, was barely half that. The longer it takes the S&P 493 (the S&P minus the Mag 7) to generate ROI, Slok points out, the bigger the downside risks to an economy and a market this concentrated in the AI trade.
If there’s reason for worry, it’s that companies are “all in”; they’ve spent their cash to generate a remarkable profits growth cycle, and in the process made themselves more vulnerable to a subsequent downswing if they run into funding difficulties.The most encouraging sign for the market is that while the AI boom is getting bigger, it’s no longer doing all the heavy lifting. Earnings growth spreading beyond the technology giants will ultimately widen the market’s profit base and reduce dependence on a handful of companies. The AI trade may yet turn earnings growth into a story bigger than the technology itself.
Author: Dawn Ridler

What Return Assumption Should You Use in Your Retirement Income Plan?
Most retirement income planning starts with a spreadsheet. You plug in your capital, your desired income, an escalation rate, and a return assumption. The tool does the arithmetic and tells you whether you’ll be okay.
The problem is that single return assumption. Get it right, and the plan is a useful guide. Get it wrong, and it’s a comfortable fiction.
I’ve built a calibration table that connects the return assumption in a simple planning tool to the probability of success from a Monte Carlo simulation: 10,000 randomly generated market scenarios, a 60% equity portfolio, and a 30-year retirement horizon. This lets us answer the question: when you plug in a return number, what are you actually saying about the odds?
Key takeaways
Why a straight-line return assumption is misleading
Here’s the core issue. A spreadsheet assumes the portfolio earns a steady return every single year. In reality, returns are volatile: some years are strong, some are deeply negative, and the order of those years matters enormously.
When you are withdrawing income from a portfolio, bad returns early in retirement do permanent damage. Capital lost early never gets the chance to compound. This is why a portfolio that averages 7% real over 30 years cannot safely support a 7% withdrawal rate. The volatility along the way is a tax on the withdrawal rate, and no simple planning tool accounts for it.
A Monte Carlo simulation does. By running thousands of possible return paths, it captures what the spreadsheet misses: the penalty that volatility imposes on a decumulating portfolio.
The calibration table
The table below maps each real return assumption (nominal return minus income escalation) to the implied probability of success over a 30-year horizon at 60% equity.
The spending strategy assumed here is the combined “Smile and Forgo” approach: spending steps down naturally in the later decades of retirement (the retirement smile), and the inflation increase is skipped in any year where the market was negative (the forgo rule). I’ve covered both of these in detail in previous articles.
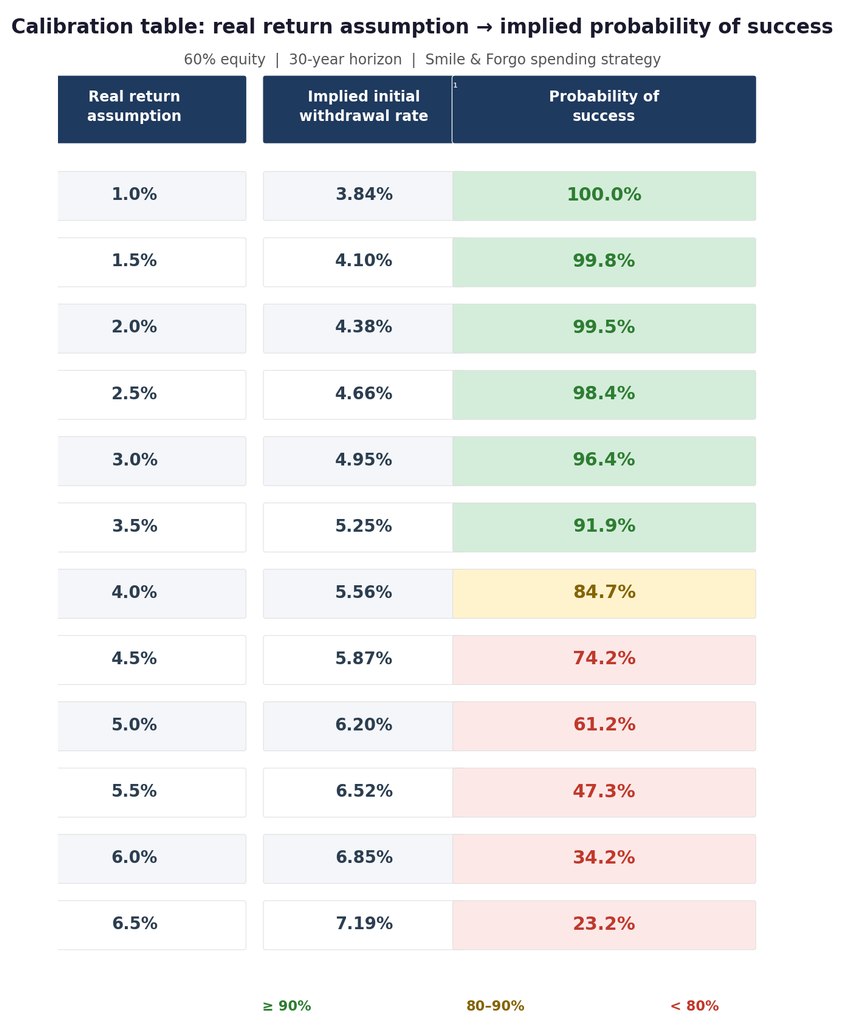
Note: The implied initial withdrawal rate is not an arbitrary input. It is derived mathematically from the real return assumption using the annuity formula for a 30-year horizon. It represents the exact withdrawal rate at which a straight-line planning tool would show your plan as 100% funded at that return assumption. Each row is therefore internally consistent: the return assumption, the withdrawal rate, and the probability of success belong together. If your actual withdrawal rate differs from the implied rate shown, the probability in that row does not directly apply to your situation.
The pattern is clear. Below 3.5% real, you’re in the green zone: better than 90% probability of success. At 4% real, you’re in amber territory: roughly 85%, which is a sensible and well-calibrated position for a flexible retiree. Above 4.5%, the odds deteriorate quickly. By 6% real, your plan has only a 34% chance of surviving the full 30 years.
For clarity, assuming a 10% annual return and an inflation assumption of 5% is effectively assuming a 5% real return.
The temptation to “solve” the problem on paper
This is where the danger lies. If a plan doesn’t work at 4% real, it’s tempting to push the return assumption to 5% or 6%. The spreadsheet will oblige: it will show the plan as fully funded. But the calibration table reveals what that assumption actually implies. At 5% real, you’re accepting a 61% probability of success. At 6%, it’s 34%. The plan hasn’t been fixed. The assumptions have been loosened until the answer looks acceptable.
A higher return assumption isn’t a strategy. It’s a hope.
A note on flexibility
This analysis assumes the retiree is willing to be flexible: allowing spending to decline naturally over time and skipping the inflation increase after a negative market year. I’ve shown previously that this flexibility is not particularly costly: the typical retiree skips the inflation increase about 3 times in 30 years, and over 87% of simulated scenarios the flexible strategy delivers higher total lifetime spending than the rigid alternative.
But flexibility must be genuine. If your essential expenses consume all of your retirement income and there is no room to adjust, then these probabilities do not apply to you in the same way. In that case, a living annuity may not be the right vehicle for all of your income and a guaranteed annuity should likely be considered. The flexibility assumption is not a free upgrade; it requires that your spending structure can actually absorb the adjustment.
Finding the balance
The calibration table is about honesty, not pessimism. An assumption of 2% real is conservative enough that almost no one would fail, but it’s also so restrictive that it may force you to live on less than you can comfortably afford. The answer isn’t to plan for the worst case. It’s to plan with clear-eyed realism about what each assumption implies. For most retirees with a diversified 60% equity portfolio and genuine spending flexibility, a real return assumption between 3% and 4% strikes a sensible balance: a probability of success between 85% and 96%. That’s the range where the plan is robust without being unnecessarily punitive.
Author: Jonathan Brummer
EXCHANGE RATES and other Indices:
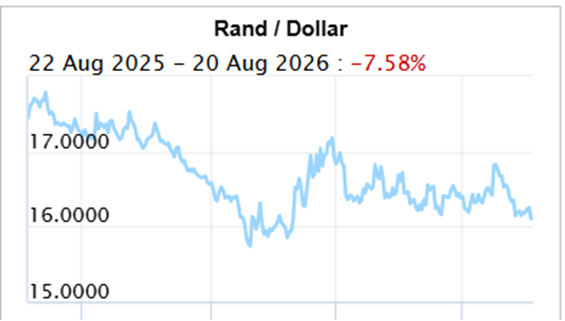
Rand/Dollar: The rand ended the week firmer at around R16.09 to R16.10 to the US dollar, up from about R16.19 a week earlier. The Rand/Dollar closed at R16.02 (R16.17, R16.14, R16.55, R16.47, R16.31, R16.22, R16.40, R16.39, R16.27, R16.55, R16.23, R16.46, R16.68, R16.39, R16.63, R16.29, R16.41, R17.07, R17.06, R16.89, R16.55, R15.93, R16.01, R15.96, R16,03, R16.15, R16.10, R16.50, …R16.91, R17.13, R17.36, R17.13,16.52 )
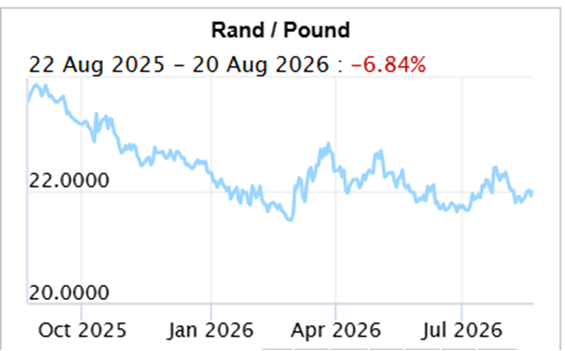
Rand/GBP: The rand eased slightly to around R22.00 to R22.04 to the British pound, from about R21.91 a week earlier. The Rand/Pound closed at R21.86 (R21.88, R21.78, R22.31, R22.16, R21.86, R21.64, R21.64, R21.67, R21.80, R22.06, R21.80, R22.09, R22.21, R22.30, R22.56, R22.35, R22.02, R22.09, R22.77, R22.76, R22.35, R22.20, R21.48, R21.59, R21.78, R21,82, R22.11, R21.97, R22.13, …R22.57, R22.68, R22.74, R22.56,
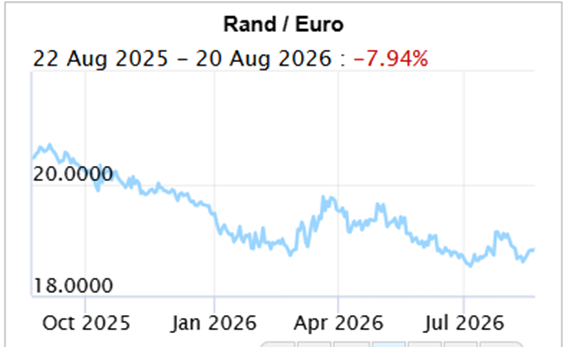
Rand/Euro: The rand eased marginally to around R18.81 to R18.82 to the euro, from about R18.73 a week earlier. The Rand/Euro closed the week at R18.72 (R18.71, R18.66, R19.09, R18.84, R18.62, R18.52, R18.66,R18.89, R19.16, R19.08, R18.91, R19.11, R19.38, R19.29, R19.48, R19.37, R19.17, R19.24, R19.70, R19.77, R19.33, R19.23, R18.80, R18.87, R18.94, R18.93, R19.14, R19.04, R19.20)
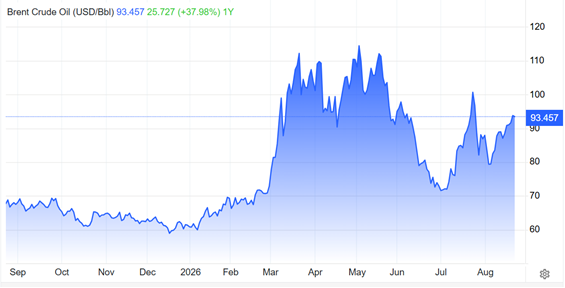
Brent crude: Brent crude climbed to around $93 to $95 a barrel, up from about $89.50 a week earlier, on the escalating Strait of Hormuz standoff.
Brent Crude: Closed the week $94.39 ($88.52, $83.55, $87.93, $88.10, $76.01, $72.10, $71.99, $80.59, $87.33, $93.09, $91.12, $104,24, $109.26, $101.29, $108.83, $105.33, $90.38, $95.20, $107.88, $112.36, $103.14, $92.88, $73.19, $71.76, $67.75, $68,05, $69.32,
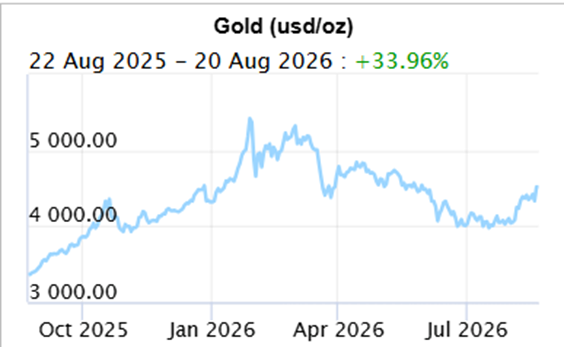
Gold: Gold rose to around $4,466 an ounce, up about 2.65% on the week and more than 11% over the past month.
Gold closed at $4,607.35
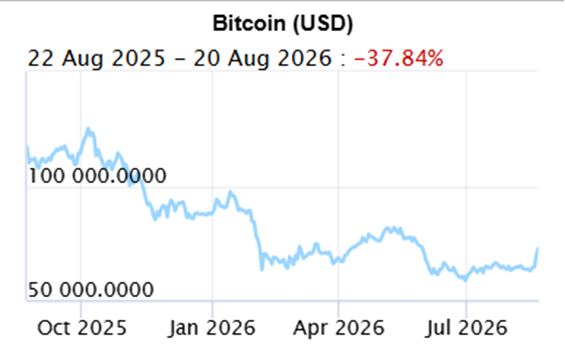
Bitcoin: Bitcoin surged past $75,500, its highest level in more than three months, putting it on track for its biggest weekly gain in over two years.Bitcoin closed at $76,532 ($62,911, $64,921, $63,143, $64,718, $63,815, $62864, $60,063, $64,029, $64,131,$60,762, $73,788, $74,559, $77,879, $80,733, $78,204, $78,049.98, $75,519, $70,904, $68,691 , $68,586, $70,869, $67,310, $63,534, $68,04, $69,649, $68,553, $81,301, $89,295, $90,585,)
Articles and Blogs:
Investment series part 1 (NEW)
Investment series part 2 (NEW)
Legacy Series Part 4
Legacy Series part 3
Legacy Series Part 2
Legacy Series Part 1
Holiday checklist
Next year – Action Plan
Next year – Vision, Mission etc
Medical Risk Mitigation
Next Year – Consolidation
Abdication or diversification?
Carbo-loading your retirement Spoiled for choice
Who needs a plan anyway
8 questions you need to ask about retirement
What to do when interest rates drop
How to survive volatility in your investments
What to do when interest rates drop
Difficult Financial Conversations
Financial Implications of Longevity
Kick Start Your Own Retirement Plan
You matter more than your kids in retirement
To catch a falling knife
Income at retirement
2025 Budget
Apportioning blame for your financial state
Tempering fear and greed
New Year’s resolutions over? Try a Wealth Bingo Card instead.
Wills and Estate Planning (comprehensive 3 in one post)
Pre-retirement – The make-or-break moments
Some unconventional thoughts on wealth and risk management
Wealth creation is a balancing act over time
Wealth traps waiting for unsuspecting entrepreneurs
Two Pot pension system demystified
Cobie Legrange and Dawn Ridler,
Rexsolom Invest, Licensed FSP 45521.
Email: cobie@rexsolom.co.za, dawn@rexsolom.co.za
Website: rexsolom.co.za, wealthecology.co.za