

The Legacy Series Blog/Post series is now complete and will be published in a free eBook next week. If you missed any of them, here are the links again.
Your summary with links, if you’d like to curate your content:
US Inflation Concerns: April US CPI hit 3.8%, its highest in three years, driven primarily by the energy price spike from the Strait of Hormuz blockage. Removing energy brings inflation down to 2.8% — still above the Fed’s 2% target. More worrying are “sticky” prices ticking back above 3% and the Fed’s “Supercore” (services ex-shelter) rising sharply. Critically, consumer prices rose faster than wages in April for the first time since 2022 — a direct hit to affordability that did not occur during Trump’s first term.
Welcome to Washington, Mr Warsh: Kevin Warsh was confirmed as a Fed governor, with confirmation as chair expected to follow. He arrives as two-year Treasury yields touch 4% — their highest since June 2025 — and markets now lean toward the next move being a hike rather than a cut. Trump dismissed the latest Iranian peace proposal as “garbage,” sending oil prices higher. The key question is whether Warsh will act as Trump’s instrument for rate cuts or uphold Fed independence as inflation pressures mount.
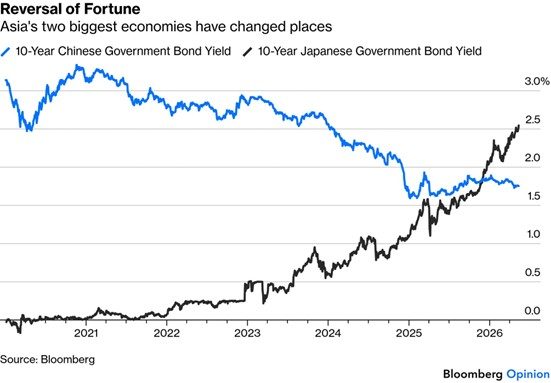
China – A Rock and a Hard Place: Trump visited Beijing for his first China trip in nearly a decade, against a backdrop of Middle East war, rare earth tensions, and the AI race. China’s export growth hit 14% year on year in April, driven by technology — far above the 8% estimate. While China officially grew 5% in Q1, consumer spending remains weak. China’s bond market signals “Japanification” risk, with 10-year yields below 2%. The newsletter argues China is poised to win the AI deployment race — leveraging manufacturing scale and rare earth advantages — even if the US leads on model quality. Whether Beijing will pressure Iran over peace negotiations depends on how much economic pain China is willing to absorb.
Never Mind Dot-Com Similarities – What About the Nifty Fifties Bubble?A historical parallel is drawn between today’s AI-driven mega-cap rally and the Nifty Fifty bubble of the late 1960s/early 1970s, when 50 blue-chip stocks traded at extreme P/E multiples before collapsing in the 1973–74 crash. Today, the top 10 S&P 500 stocks (all tech) represent ~40% of the index — comparable to the Nifty Fifty’s ~45% concentration but far less diversified by industry. Strong earnings justify some optimism, but the enormous costs of AI data centre buildouts and inevitable head-to-head competition among AI platforms could pressure margins significantly.
Producer Prices – A Foreshadowing: US PPI topped 6% year on year — near historical highs outside of the post-pandemic surge. Electronic components rose 8% month on month and 27% year on year, ending decades of persistent cost deflation in tech. Bloomberg’s non-energy commodity index hit an all-time high. These producer price pressures are a leading indicator of consumer price inflation to come, and could badly disrupt corporate cost assumptions across many industries.
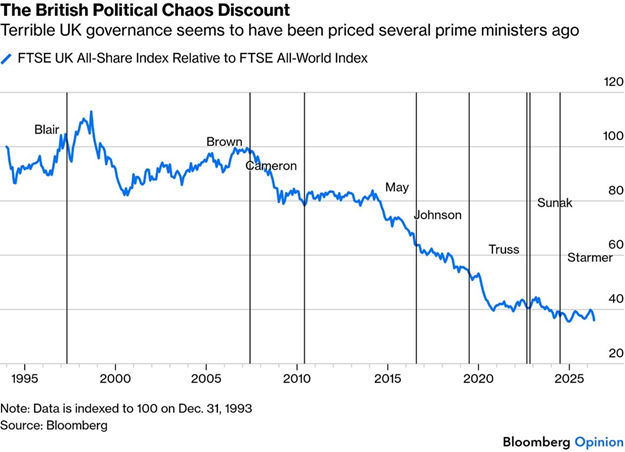
Keir We Go Again: Starmer remains in deep political trouble but markets have largely priced in UK political dysfunction — gilt yields are tracking the oil price rather than political risk. Polymarket puts his odds of leaving by year-end above 50%, yet bond markets are not reacting dramatically to succession uncertainty because no alternative candidate is seen as an improvement. UK stocks have underperformed globally for years across seven successive prime ministers, and markets simply expect more of the same.
Electric Fury: Rising electricity prices are becoming a major US political issue ahead of the midterms. AI data centre demand, an ageing grid, tariffs, and Trump’s ban on new wind installations are all driving power costs higher. US electricity demand is forecast to grow 25% by 2030 and 78% by 2050 from 2023 levels, requiring ~80GW of new capacity annually. The Nevada/Lake Tahoe case — where data centres are consuming 22% of the state’s electricity and displacing residential supply — is an early warning of systemic grid stress. Similar energy affordability pressures are building in Europe, Japan, the UK, and Italy from the Iran war’s impact on gas supplies.
US Inflation vs the Market: US CPI of 3.8% in April barely dented markets — the S&P 500 fell just 0.16% on the day before resuming its climb. The IT sector (23% of the MSCI ACWI, predominantly US) continues to drive indices higher through strong earnings clarity. A notable structural shift is emerging: SA CPI (3.1%) is now below US CPI (3.8%) — a reversal of the historical norm. Consumer-facing US companies are beginning to miss earnings estimates as their customer base weakens under inflation pressure, while tech continues to dominate. The bull market’s end remains a question of when, not if.

This Week’s Roundup
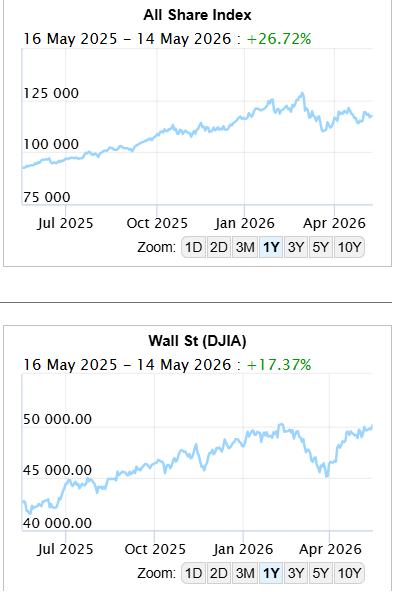
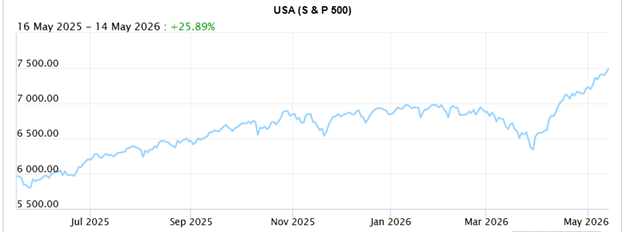
The University of Michigan’s consumer sentiment index hit an all-time low in May, with consumers scarred by years of rapid price growth and a succession of financial shocks, even as actual spending data from companies such as Uber and Disney showed resilient household expenditure, suggesting a structural breakdown in the traditional correlation between sentiment and spending.

US Inflation concerns US inflation is too hot for comfort (Cobie gives another angle on this, below). The numbers for April reveal that the headline rise in consumer prices reached 3.8%, continuing an upward trend that started before the Iran war and well above the Federal Reserve’s upper target of 2%. Overall inflation hasn’t been this high in three years:
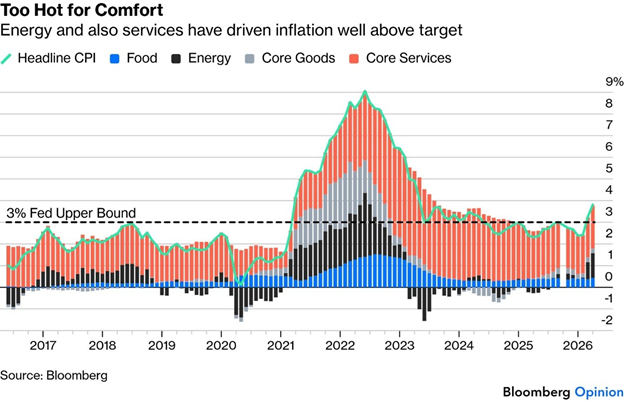
The greatest problem is, of course, the spike in energy prices driven by the blockage of the Strait of Hormuz. Energy prices are always erratic, and there is little monetary policy can do to control them, which is why central banks tend to look at core inflation, excluding both food and fuel. (This is also true in South Africa – monetary policy can do little to ease imported inflation). Merely removing energy is enough to bring US inflation down to 2.8% (still a way off the 2% target). Inflation excluding energy is still rising, while an array of other statistical measures of core price increases are also turning upward. Sticky prices, which take time to move and are hard to reduce, have ticked back up above 3%, while the Fed’s so-called “Supercore” (services inflation minus shelter) rose sharply. There is more to this than the first-order effects from the oil
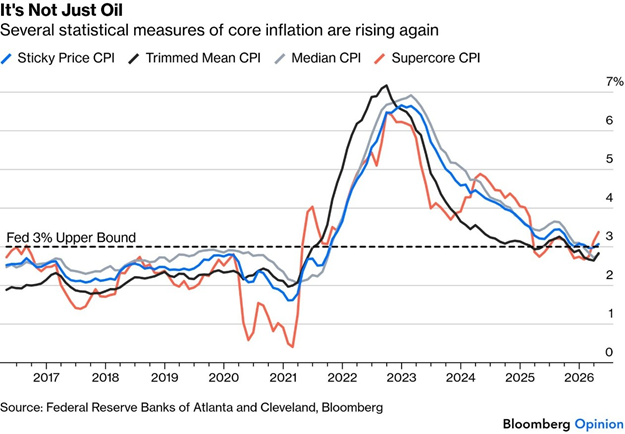
The really bad political news is on affordability. Prices can rise without making life less affordable if wages rise faster, which is what usually happens. But last month, consumer prices rose faster than average hourly earnings, for the first time since 2022. This never happened during the first Trump term.

Welcome to Washington, Mr. Warsh
Fittingly, the inflation data landed just as the Senate confirmed Kevin Warsh as a governor of the Fed, to replace the ultra-Trumpy Stephen Miran. Confirmation as the next chairman will almost certainly follow. Get out your popcorn, folks, is Mr Warsh going to be Trump’s lapdog or are they going to butt heads? Last week we discussed how Powell is going to retain his Fed governorship, which is why there is not a ‘spare seat’ for Steven Miran to stay on, and he had to vacate it for Warsh.
He arrives just in time for two-year Treasury yields to touch 4%, their highest since June last year, buoyed by the strong market expectation that the fed funds rate cannot move far from where it is now, but that the next move is now more likely to be a hike than a cut.
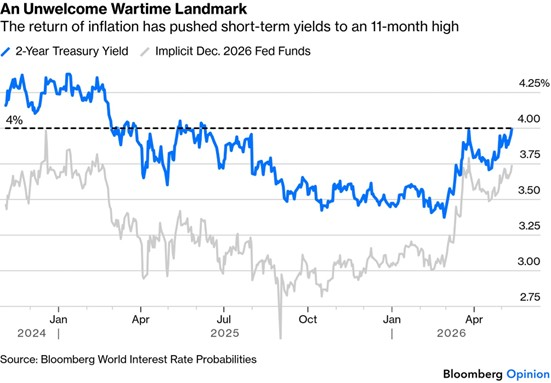
This is a direct byproduct of the war in Iran, which instantly pushed up both short-term yields and rate expectations. The latest miserable news, with Trump dismissing the most recent Iranian peace proposal as “garbage,” had a predictable effect on oil prices. By the sounds of things, the Chinese aren’t going to help him get out of this mess. But if there’s no dilemma for the moment, the odds are that there soon will be. Inflation is growing, and if the supply shock persists, there will also be a threat to growth. How Warsh chooses to frame expectations when he takes over promises to be crucial.

China – a rock and a hard place
US-China détente is back, this time featuring a second meeting in seven months between Donald Trump and Xi Jinping, and the president’s first visit to Beijing in nearly a decade. The backdrop has been shaped by war in the Middle East, tensions over rare earths, and an accelerating AI race that Washington appears determined to win, if necessary, through measures like restricting Beijing’s access to advanced semiconductors.
The last visit in 2017 heralded a trade war, whose effects can still be felt today. Trump’s second-term push to continue where he left off hasn’t quite worked out, though, with the Supreme Court blowing a hole in his tariff policy and China using its critical leverage over rare earths, which are crucial to US AI ambitions.
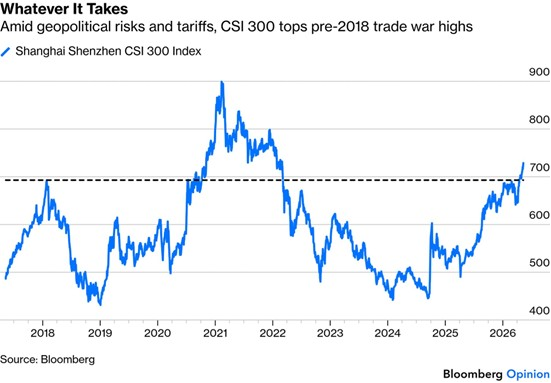
As far as Corporate China is concerned, the Shanghai Shenzhen CSI 300 Index has yet to recover its pandemic highs, but it recently surpassed its pre-Trump 1.0 trade-war peak. That’s hardly resounding success.
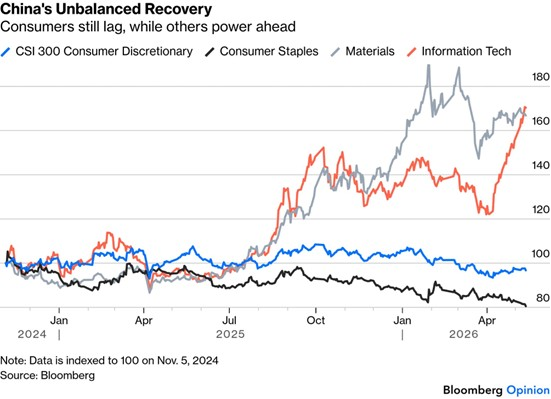
The internal dynamics of the stock market recovery since Trump’s return to the White House show that China’s ongoing attempt to stimulate a consumer-driven economy is still not happening, while tech and the traditional stronghold of materials have rallied impressively.
The bond market speaks volumes about the state of the Chinese economy. While it has not outright “Japanified,” the perceived growth and inflation prospects have declined, bringing 10-year yields below 2%. Remarkably, Japanese yields, long held below zero, are now significantly higher.
For Beijing, the lessons from 2018 are embedded in policies that promote self-reliance, de-risk its supply chains, and seek to build export markets beyond the US. While it’s still too early to declare this pivot an outright success, China’s resilience in weathering the hits from the Covid-Zero shutdowns in 2022, international investors’ furious reaction to the clampdown on the private sector, the collapse of its housing sector, and the escalating tensions with Washington, all while sustaining official growth near 5%, has been remarkable.
The latest Chinese trade data offer another reminder of the counterintuitive consequences of US policy and of Beijing’s growing decisiveness in remaking its economy. Exports in April grew more than 14% year-on-year, easily beating estimates of about 8%. That was despite elevated freight prices arising from the Iran war:
More concerning for Washington is the primary driver behind these exports: technology.
The unease among US policymakers and Silicon Valley over the intensifying two-horse AI race with China helps explain the export controls and technological chokepoints they’ve imposed on Beijing. Yet while restrictions on advanced chips largely remain in place, China’s expanding technology exports don’t offer much reassurance.
Beyond exports, China’s ingenuity in the face of adversity is quietly delivering results. The latest Five-Year Plan advances Beijing’s goal of increasing self-sufficiency and transforming the country into a high-tech manufacturing powerhouse.
Beijing has increased its global market share in each sector, partly at the expense of the US:
Whatever Trump’s objective in Beijing, the Communist Party’s demonstrable resilience should not be lost on him.
In AI, the US may have a proven head start with advanced chips, an advantage China lacks. But abundant power generation capacity and rare earths give the world’s second-largest economy key advantages.
The US is running fast to build the biggest and best AI models. The AI models might still be the best in the world. But they lag in adoption. They’re taking too long to build and use the applications that will actually improve lives. That is where the rubber meets the road.
China is poised to win the deployment race, given its supply chain and manufacturing scale advantages. Having the best models in the world won’t matter if the American people can’t or won’t use them (or, more importantly perhaps, pay for them).
Despite Beijing’s dependence on the Strait of Hormuz for energy imports, its economy has so far been relatively insulated. How long it can stay resilient is now crucial. China faces the risk of export demand destruction if a prolonged energy shock tips the global economy into recession. Whether Beijing accepts Washington’s overtures to pressure its allies in Tehran on the peace negotiations may depend on the price it’s prepared to pay to remain on the sidelines.

Never mind Dot Com similarities, what about the Nifty Fifties bubble?
It has been more than 50 years since the high-flying Polaroid Corp. fell back to earth during the collapse of the famed Nifty Fifty bubble. At its peak, Polaroid controlled nearly two-thirds of the instant-camera market and traded at earnings multiples exceeding 90x. Other Nifties enjoyed similarly extreme multiples, beyond anything in today’s AI-driven rally.
Nifty Fifty was a group of highly admired U.S. blue-chip stocks in the late 1960s and early 1970s that investors believed could be bought at any price and held forever. It argues that easy money, credit expansion, and investor optimism pushed valuations far beyond reasonable levels, creating a bubble.
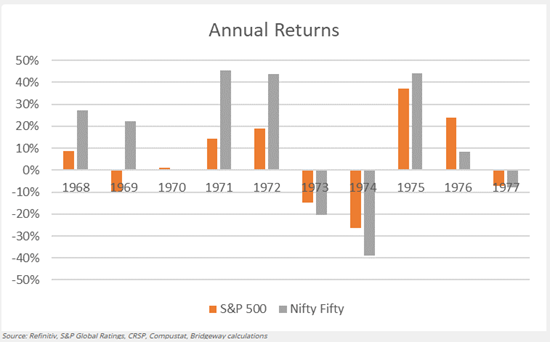
The boom was driven by strong brands and steady growth stories, but the real fuel was liquidity and the belief that these companies were “one-decision stocks.” By 1972, many of them traded at extremely high P/E ratios, far above the broader market.
The 1973–74 crash exposed how overvaluation matters even for excellent businesses. Many stocks fell sharply, showing that strong fundamentals do not protect investors from overpaying.
The takeaway is simple: easy money can inflate even quality assets into bubbles, and discipline around valuation matters more than popularity or prestige.
When the bubble burst, the Nifties brought the whole markets down with them, underperforming along the way.
Obviously, this drives comparisons between the two eras.
The Nasdaq 100 closed last Wednesday at yet another record — but could its momentum ultimately unravel? The prevailing investor enthusiasm bears striking resemblance to the optimism around the Nifty Fifty half a century ago, even as market breadth appears considerably narrower now than it did then.
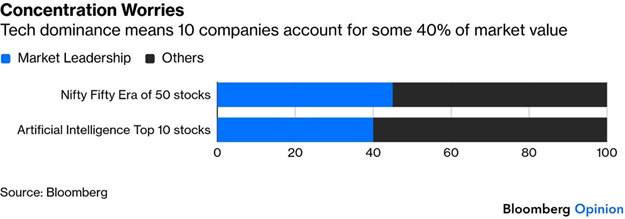
In recent months, robust earnings across the board have led to a slight diversification away from the mega caps. But concentration is much greater now than in 1972. Such levels, coupled with unrestrained spending on AI data-centre buildouts, make it difficult to dismiss the possibility that the trade could unravel in a painful way.
At the peak of what felt like an unassailable dominance in the early 1970s, the Nifty Fifty, a group of 50 stocks, accounted for roughly 45% of the S&P 500 value, though market leadership at the time was spread across a more diverse mix of industries. Meanwhile, as of May 13, 2026, just the top 10 — all tech groups, excluding Berkshire Hathaway, account for roughly 40% of the index.
To be fair, earnings are on a record tear, particularly for semiconductors. Margins are remarkable. But previous bubbles were not entirely speculative either; Polaroid, Kodak, Xerox and the others exerted similar dominance from their wide economic moats. Mega-cap profits could soon feel pressure from the enormous costs of the data-centre buildout, and then from the fact that the AI monsters now being built will ultimately compete against one another. Head-to-head competition, while good for consumers, is all but certain to damage profits.

Producer prices – a foreshadowing
US producer prices brought fresh evidence that the oil supply shock is beginning to ripple through into other prices. The producer price index is always more prone to big swings than consumer prices, but an outcome above 6% y-o-y topped estimates and brought it right to the heights of its historical range since the 1980s, excluding the post-pandemic surge.
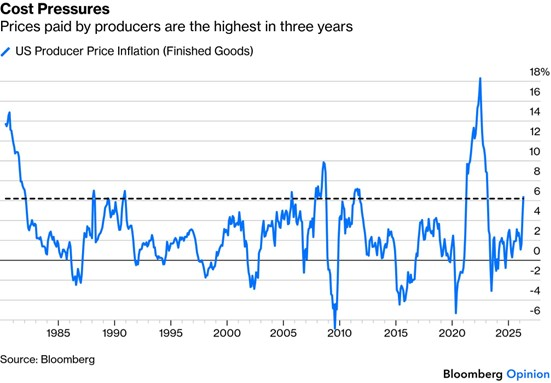
There are other signs of building pressures. While gasoline prices naturally hog attention, Bloomberg’s index for all non-energy commodities is also now at an all-time high, even though precious metals, an important component, are down about 15% since their peak in January.
Prices of electronic components and accessories rose by 8% month-on-month, as demand for AI has created a shortage of memory chips. Electronic components inflated by 27% year-on-year, ending decades of persistent cost reduction. This could throw many companies’ assumptions badly awry.
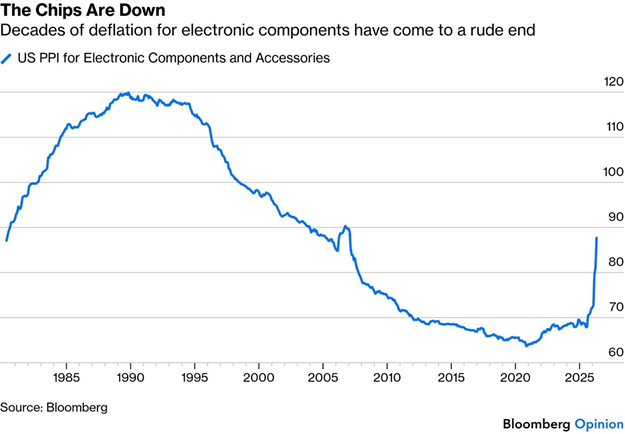
Until now, as we’ve seen, the sole market reaction to this development has been to send the share prices of chip manufacturers into the stratosphere.

Keir Starmer, the UK’s prime minister, is in awful political trouble. This isn’t new for the country. Since 2010, which saw the end of 13 years of Tony Blair/Gordon Brown centre-leftism, which had followed directly from 18 years of free-market right-wing policies under Margaret Thatcher/John Major, political intrigue and uncertainty have become the norm.
Starmer is the sixth prime minister since then, in a period that has been characterised by either unstable coalitions or fierce internal battles whenever one party has a strong majority in Parliament.
In a long-term perspective, it’s obvious that the UK’s political instability has been economically harmful. It’s also wrought havoc with financial markets. As bond market investors are already alarmed about fiscal stability, and any replacement for Starmer would almost certainly worsen the problem (in their eyes) by loosening fiscal spending, this is a dangerous situation. Gilt yields are now slightly higher than they were when a bond market revolt forced the ejection of Liz Truss in 2022:
But while Starmer, like Truss before him, appears to be in terminal difficulties, it’s not clear that his political problems have had any great impact on bonds just yet. The UK is more economically exposed than the US to the Iran war, and the extra spread on gilt yields compared to Treasuries has moved almost directly in line with the oil price since the outbreak of hostilities.
Why, then, is the Starmer effect muted?
In part because he has evidently been in trouble for a while, and markets have long been priced on the assumption that he probably won’t last beyond the end of this year. Polymarket’s contract on Starmer leaving his job by Dec. 31 was initiated six months ago, and it has nearly put the odds at more than 50%. The mess around choosing a successor doesn’t significantly add to the UK’s financial damage, as the market in general doesn’t think any of the alternative candidates would be an improvement.
In stocks, Britain’s underperformance has endured for years. The slide started long before the 2016 Brexit referendum, although that certainly made things worse. After seven successive prime ministers who oversaw a stock market that underperformed the rest of the world, the market seems satisfied that it’s priced in British political dysfunction. There were no great expectations of improvement under Starmer, and there is no disappointment now that his premiership is panning out as badly as investors expected.Lousy UK political governance, it would appear, is already priced in. There’s no prospect of that changing. That’s miserable for the country’s prospects. It also explains why the century-old Labour-Conservative duopoly seems finally to have been broken, as Britons have had enough. But in the shorter term, it probably means that the market downside from Starmer’s agonies isn’t as severe as it might appear.

It isn’t just the price of petrol/gas that is getting ordinary Americans hot under the collar in the run-up to the midterm elections, but it’s electricity too.
The rapid build-out of artificial intelligence data centres, along with tariffs and upgrades to an ageing grid, has driven power prices to levels unseen in decades. The war in Iran is throwing global energy markets into upheaval, adding a surge in gasoline prices to affordability concerns.
The energy strains have propelled the once-mundane utility bill to the centre of US politics, a place it hasn’t occupied since electricity became a staple of American life. After a 2024 election in which voter concerns over inflation and the economy helped send Donald Trump back to the White House, the outcome of this year’s midterms stands to be as much about the price of power as the price of groceries.
Democrats who focused on household energy costs swept key elections in New Jersey, Virginia and Georgia late last year, a grim omen for incumbent Republicans trying to hold on to a razor-thin margin in the US House of Representatives. Trump himself brought up the issue in his February State of the Union speech, unveiling a plan to have tech companies build their own power plants for their AI data centres. It was the first time in the history of the annual address that a president explicitly framed rising electric bills as a consumer concern.
It’s completely unprecedented in modern history for it to be talked about nationally and for it to be a campaign issue.
Another surprising issue playing into this emerging electricity crisis is Trump’s somewhat irrational loathing of windmills. All new installations have been banned by Don Trump-Quixote in his new tenure.
In the U.S., wind generated about 434 billion kWh in 2022, accounting for about 10.3% of utility-scale electricity generation. Projects currently stalled could have added about 30 GW of capacity.
The immediate effect is less new electricity reaching the grid, which can tighten supply in regions already facing rising demand. Analysts and advocates quoted in recent coverage say this can raise electricity prices, reduce investment confidence, and delay enough power to serve millions of homes.
One of the things that has pushed this issue onto the front pages is the Lake Tahoe/Nevada utility story: NV Energy plans to stop supplying about 75% of Liberty Utilities’ electricity for the California side of Lake Tahoe by May 2027, and reporting links that shift to rising demand from AI/data centres in Nevada. That affects about 49,000 customers. This is seen as an early red flag for the dangers of the power (and water) hungry datacentres that are springing up all over the world.
The ‘electricity’ industry in the US is privately held, which is causing concern. The core issue is not that power is being “turned off,” but that the utility’s supply mix is changing, forcing Liberty Utilities (in this instance) to find a replacement source of electricity. Liberty says the transition is part of routine contracting, while reporting and local advocates say the timing lines up with data-centre demand growth.
Nevada has become a fast-growing data-centre hub, especially around Reno and the Tahoe-Reno Industrial Centre. One Nevada-focused report says data centres used 22% of the state’s electricity in 2024 and could rise to 35% by 2030, which helps explain why utilities are reshuffling supply.
The concern is that large new AI loads may crowd out existing customers or force higher infrastructure spending that gets passed on to households. Local reporting says some residents may have to secure a new supply by 2027, which is why the story has become a big consumer and grid-policy issue.
The pressure will intensify. The North American Electric Reliability Corp., the country’s grid security regulator, forecasts that US power demand in summer will rise 224 gigawatts over the next decade—roughly the equivalent of adding 180 million homes. One analyst said the last comparable surge came during World War II.
Higher energy costs are making waves around the world. The war in Iran is hitting fuel supplies in Europe and Asia, which depend on Middle East natural gas for electricity. Japanese Prime Minister Sanae Takaichi, whose ruling party secured a historic victory in the February elections, has said her administration is looking into measures that could be implemented to curb the rise in power and gas prices in the wake of the war. In the UK, opposition parties are campaigning on lower bills and blaming climate goals for utility rate hikes, while the Italian government is under pressure from industry to cut high power costs.
In the US, where narrow margins in a few swing districts can tip the balance of power in Washington, even modest changes in voter sentiment can have a profound effect. In a 2025 poll by Ipsos, three in four respondents voiced concern about rising utility bills. Electricity prices are playing a role in some of the midterms’ most competitive races in Ohio, Maine and Michigan. In Virginia, home to the world’s largest concentration of data centres, Representative Jen Kiggans warns on her website that “sky-high energy bills” have hit her constituents hard. After the Trump administration halted construction on permitted offshore wind projects, the Republican wrote that the delay was preventing her district, Virginia’s 2nd, from accessing affordable power.
U.S. electricity demand is projected to rise sharply over the next 25 years, with one major forecast calling for a 25% increase by 2030 and 78% by 2050 versus 2023 levels. That same forecast says the U.S. will need about 80 GW of new generation capacity a year between 2025 and 2045 to keep up with demand growth.
The main drivers are data centres, AI/cloud computing, industrial reshoring, building electrification, and EV adoption.
Useful numbers:
• 25% demand growth by 2030 from 2023 levels.
• 78% demand growth by 2050 from 2023 levels.
• About 80 GW of new capacity is needed annually from 2025 to 2045. • Estimated residential rate increases of 15% to 40% by 2030 in some markets.
Author: Dawn Ridler

As markets continue to crest, there is a lot of speculation as to when this bull market is going to end. The reality for large tech companies is that they are providing some of the largest earnings growth rates and better look through than what other sectors are providing. The IT sector makes up 23% of the MSCI ACWI and then most of these companies reside in the US which has a 62% weighting in the index. The MSCI All Country World Index is actually a majority US index with the rest of the world making up the minority.
The rise of inflation and the fear of stagflation have investors worried. It now seems that the Iran crisis could drag on, with oil prices remaining at circa $100 for a while longer.
All of this drives inflation higher. US inflation was recorded at 3.8% y-o-y in April, up from the 3.3% reading in March. When the number was released on 12 May, the S&P 500 recorded a -0.16% return but continued its upward spiral on 13 and 14 May. The only reason markets do this is that there is clarity on the IT sector earnings, which diminishes the chances for guesswork.
The 3.8% CPI number, though, doesn’t fall neatly into what policymakers were hoping for, and the Iran war can only aggravate this.
As I have said before, rate cuts are all but done with the Fed Funds rate targeting a range of 3.5% – 3.75%. South African CPI is actually below US CPI at the moment, having been recorded at 3.1% in March. But look how inflation dynamics have changed:
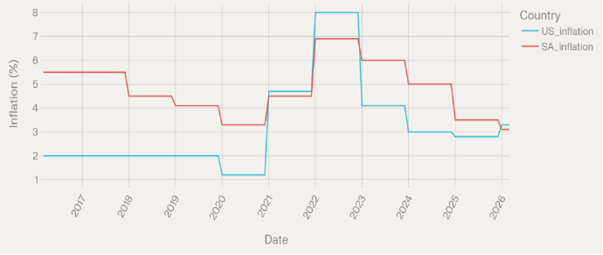
We are used to SA CPI running higher than US inflation, as is evident from the chart (2016-2021). Then the Covid years saw US inflation briefly exceed its SA counterpart before dropping again below SA Inflation. US policymakers were hoping that they could go back to 2%. But since 2023, the gap between the 2 have been closing. There may be technical reasons for this, but it does indicate that the inflation environment in the US may have changed.
This does place a larger burden on consumer stocks in the US. In these sectors, we are seeing some companies starting to miss their earnings estimates. Some of it is structural, but in other cases, it’s because of a weakening customer base. These companies are summarily sold down by the market. In these sectors, value is returning whilst the inflation environment might yet hold some more upside surprises.
This is whilst tech companies continue to lead with their earnings, pushing indices even higher. As with all things, this will end at some point. The question is when?
Author: Cobie Le Grange
EXCHANGE RATES and other Indices:
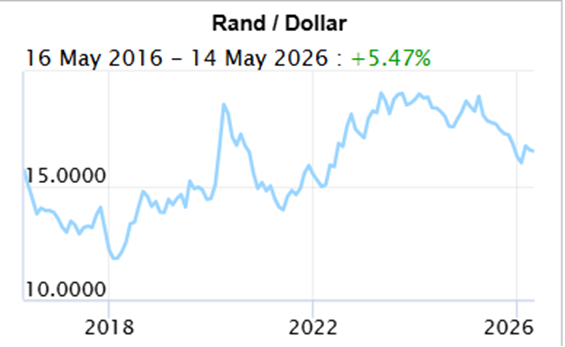
The Rand/Dollar closed at R16.68 (R16.39, R16.63, R16.29, R16.41, R17.07, R17.06, R16.89, R16.55, R15.93, R16.01, R15.96, R16,03, R16.15, R16.10, R16.50, …R16.91, R17.13, R17.36, R17.13,16.52 R17.27, R17.31, R17.25, R17.38, R17.50, R17.22 , R17.35, R17.33, R17.37, R17.58, R17.65, R17.44, R17.61, R17.74, R18.15,R17.76, R17.72, R17.90, R17.58, R17.89, R17.99, R17.92, R17.77, R17.95, R17.88)
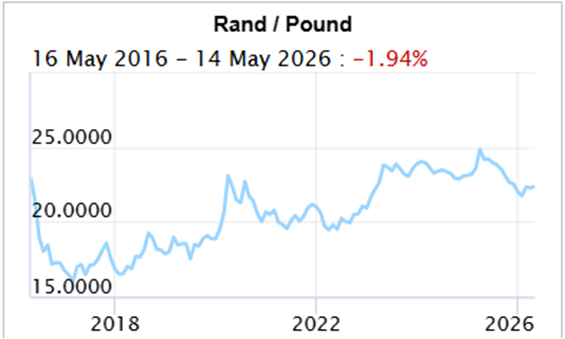
The Rand/Pound closed at R22.21 (R22.30, R22.56, R22.35, R22.02, R22.09, R22.77, R22.76, R22.35, R22.20, R21.48, R21.59, R21.78, R21,82, R22.11, R21.97, R22.13, …R22.57, R22.68, R22.74, R22.56, R22.69, R22.76, R22.96, R23.34, R23.37, R23.19, R23.22, R23.35, R23.55, R23.73, R23.84, R23.53, R23.84, R23.84, R24.09, R23.88, R23.76, R24.22, R24.08, R24.49, R24.22, R24.35, R24.05, R24.18)
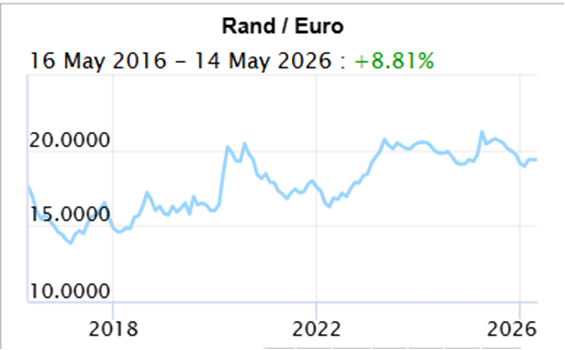
The Rand/Euro closed the week at R 19.38 (R19.29, R19.48, R19.37, R19.17, R19.24, R19.70, R19.77, R19.33, R19.23, R18.80, R18.87, R18.94, R18.93, R19.14, R19.04, R19.20, …R19.68, R19.86, R19.99, R19.96, R19.98, R20.02, R20.06, R20.26, R20.33, R 20.22, R20.30, R20.35, R20.38, R20.61, R20.62, R20.44, R20.56, R20.64, R21.04, R20.86, R20.61, R20.93, R 20.70, R20.91, R20.74, R20.68, R20.24, R20,37)
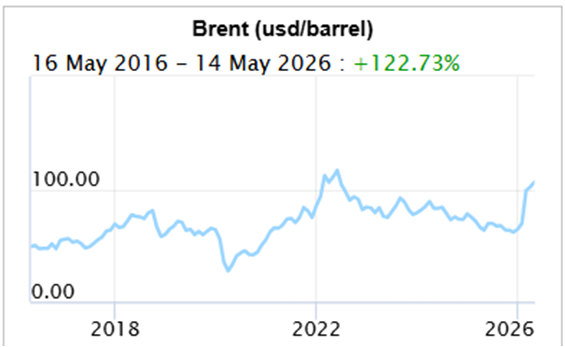
Brent Crude: Closed the week $109.26 ( $101.29, $108.83, $105.33, $90.38, $95.20, $107.88, $112.36, $103.14, $92.88, $73.19, $71.76, $67.75, $68,05, $69.32, $65.88, $63.34, …$63.71, $63.19, $62.42, $63.94, $63.61 $64.66, $65.04, $61.27, $62.14, $64.28, $69.67, $66.57, $66.80, $65.52, $67.38, $67.73, $66.08, $66.07, $69.46, $68.29, $69.21, $70.58, $68.27, $67.39, $77.27, $74.38, $66.56, $62.61, $65.41)
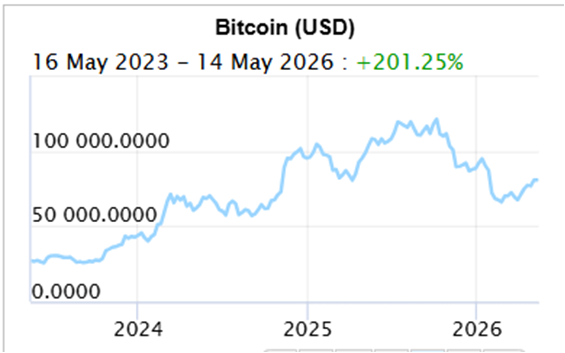
Bitcoin closed at $77,879 ($80,733, $78,204, $78,049.98, $75,519, $70,904, $68,691 , $68,586, $70,869, $67,310, $63,534, $68,04, $69,649, $68,553, $81,301, $89,295, $90,585, … $90,809, $86,334, $94,990, $101,562, $109.936, $112,492, $106,849, $111,888, $124,858, $109,446, $115,838, $115,770, $110,752, $108,923, $114,916, $117,371, $118,043, $113,608, $118,139, $118,214, $117,871, $108,056, $107,461, $103,455)
Articles and Blogs:
Legacy Series Part 4 NEW
Legacy Series part 3
Legacy Series Part 2
Legacy Series Part 1
Holiday checklist
Next year – Action Plan
Next year – Vision, Mission etc
Medical Risk Mitigation
Next Year – Consolidation
Abdication or diversification?
Carbo-loading your retirement Spoiled for choice
Who needs a plan anyway
8 questions you need to ask about retirement
What to do when interest rates drop
How to survive volatility in your investments
What to do when interest rates drop
Difficult Financial Conversations
Financial Implications of Longevity
Kick Start Your Own Retirement Plan
You matter more than your kids in retirement
To catch a falling knife
Income at retirement
2025 Budget
Apportioning blame for your financial state
Tempering fear and greed
New Year’s resolutions over? Try a Wealth Bingo Card instead.
Wills and Estate Planning (comprehensive 3 in one post)
Pre-retirement – The make-or-break moments
Some unconventional thoughts on wealth and risk management
Wealth creation is a balancing act over time
Wealth traps waiting for unsuspecting entrepreneurs
Two Pot pension system demystified
Cobie Legrange and Dawn Ridler,
Rexsolom Invest, Licensed FSP 45521.
Email: cobie@rexsolom.co.za, dawn@rexsolom.co.za
Website: rexsolom.co.za, wealthecology.co.za