

Too Busy? Got Better Things to Do? Read the Summary…
Oil price moves and Strait of Hormuz traffic remain closely linked, with prediction markets more pessimistic than financial markets about a near-term return to normal shipping. BofA’s fund manager survey, taken as tensions were escalating, showed managers at their most bullish since the post-pandemic surge, with cash holdings dropping below the 4% level BofA treats as a sell signal, an optimism that events since have called into question.
Crowded trade: Semiconductors:
Over 80% of surveyed fund managers now call semiconductors the world’s most crowded trade. Some correction has already hit chip stocks while hyperscaler customers have recovered modestly, but easing conditions built on softer inflation data carry the risk of reversing if that data proves temporary.
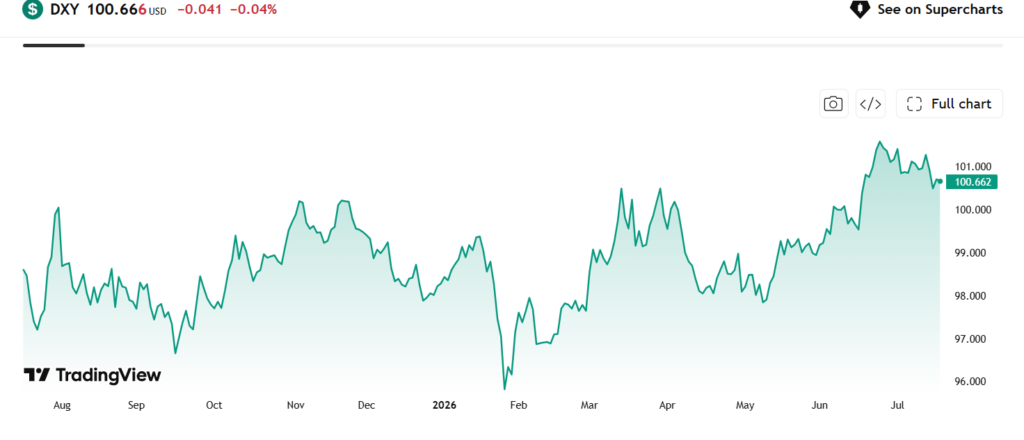
The dollar’s safe-haven rally this year faces a test as hawkish Fed minutes are undercut by softer inflation prints. Most surveyed managers see the dollar as overvalued, third-quarter seasonality tends to work against it, and a strong US earnings season may matter more for the currency’s direction than the latest inflation numbers.
Elon, no longer the flavour of the month:
SpaceX shares have slumped to their lowest level since listing, briefly dipping below the IPO price, with a share lockup expiry looming once quarterly results land. Separately, Subversive ETFs has filed for two new funds, QQNE and SPNE, that track major indexes while excluding Musk-linked holdings such as Tesla and SpaceX, set to launch September 21, 2026.
The Public Investment Corporation suspended CEO Patrick Dlamini amid a governance probe tied to a whistleblower report and a PwC investigation into a Lanseria airport deal. The Financial Sector Conduct Authority has opened its own investigation, tension has emerged between Finance Minister Godongwana and Deputy Minister Masondo over the handling of the matter, and CFO Batandwa Damoyi has stepped in as acting CEO.
This new series reviews Regulation 28-compliant balanced funds using published fund fact sheets. The Rexsolom Balanced fund returned 16.5% annualised over three years, ahead of the 12.6% category average and the 8.53% CPI plus 4 benchmark, with the piece advising investors to weigh five-year top quartile consistency over cost alone.
Peak liquidity describes the point where money supporting asset prices, including central bank balance sheets, bank credit and buybacks, stops accelerating and starts to flatten, capping multiple expansion even as earnings hold up. Some signs suggest a liquidity peak could form toward late 2026 or early 2027, with energy prices remaining the key risk to watch.
Momentum investing rests on the tendency for recent winners to keep outperforming and recent losers to keep lagging, at least for a period, driven by behavioural underreaction, herding and institutional flows chasing performance. It sits opposite the value trade and is treated as its own investable factor alongside value, quality and size.
Resources:A look back at Resources, Industrials and Financials shows commodity shares leading over three, five and ten year periods, boosted by a 126% gold driven gain in 2026, while returns converge over fifteen and twenty year horizons. The piece argues that given today’s broad ETF options, resource exposure through an ETF should be treated like any other portfolio building block rather than a no go area for active managers.


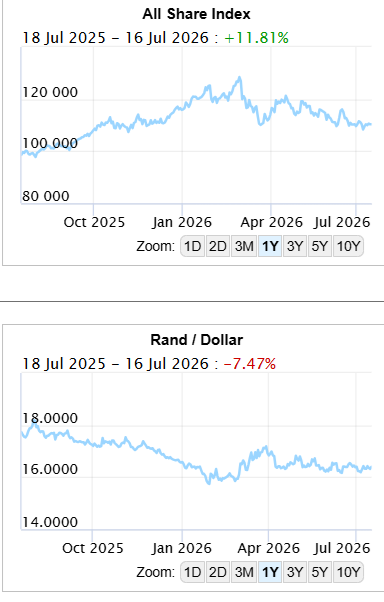



Understanding life backwards, the only way that’s possible, we can say with some confidence that two weeks ago, everything was looking awesome.
The arrow of causation between the oil price and the supply blockage through the Strait of Hormuz points both ways. If the price rises much higher, the chances are that efforts to find a workable compromise will be redoubled, while the sharp drop toward the end of June emboldened Iran and the US to return to hostilities.
As it stands, however, prediction markets — which have always seemed more bearish about the Mideast situation than the financial markets linked to it — have grown sharply more pessimistic about the chance that normal traffic can return even by the end of this year.
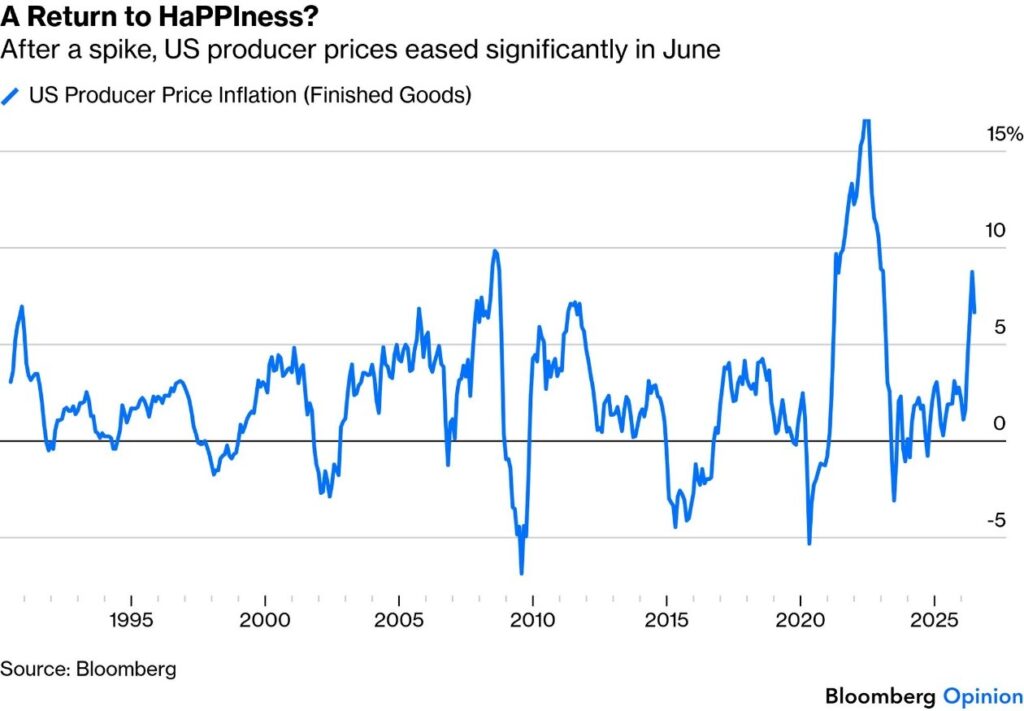
How much should the turn in the Middle East colour the June data, which showed inflation moderating (and doing so broadly, beyond oil) while the labour market cooled off? The question is particularly tricky when applied to the latest numbers, on producer prices. The headline shows a sharp improvement in June, after what had been a menacing spike:
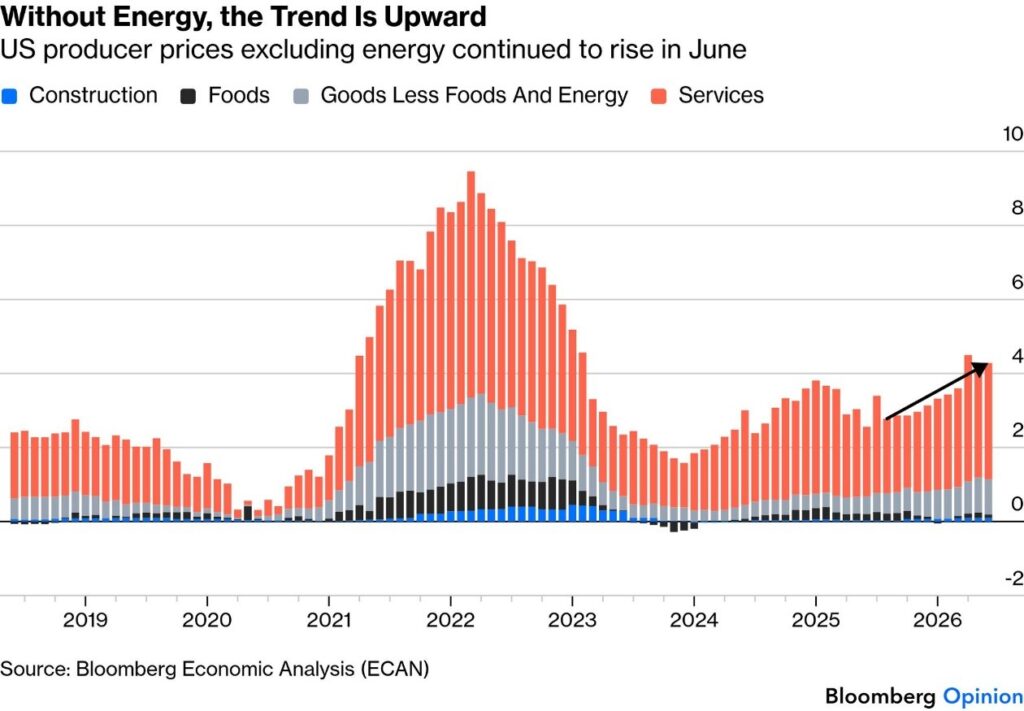
But this owed a lot to energy. Stripping that out, the trend in all the other components of the index was clearly upward (which wasn’t true of consumer prices). With energy costs rising again, the question of whether businesses must eventually pass higher prices on to consumers must return to the agenda:
There’s a further issue when it comes to “sentiment surveys”.
Bank of America has just published its latest poll of global fund managers, who were interviewed between July 2 and July 9 as the Middle East situation began to veer out of control. At that point, they were their most bullish about prospects for the world economy since the post-pandemic inflation surge. A majority now think there will be neither a “soft” nor a “hard” landing, and that the economy can continue powering on without a significant dip. Short-termism in real time!
That strong optimism for growth was expressed in very bullish positions in the stock market. Their cash holdings dropped below 4%, reaching a level that BofA usually regards as a “sell” signal. It did this, remember, just as international events conspired to provide their own excuse to sell.
That was plainly driven in large part by optimism on the oil price. (When will they actually realise that all it takes is for Trump to get out of bed on the wrong side one morning for this to change in a Mar-a-Lago minute? Fund managers got this bullish on the assumption that crude would finish the year somewhere between $70 and $80.
This was in line with market pricing until last week — Brent crude for delivery in time for next January is now trading at a few pennies over $80.
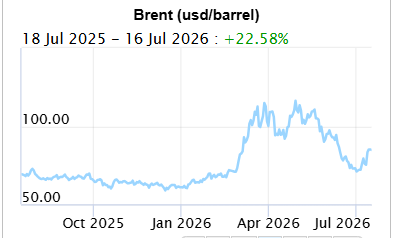
The events of last week certainly don’t negate the positive views people held last month, but they clearly suggest that the optimism wasn’t fully grounded. If the Middle East situation were to deteriorate significantly with the destruction of oil infrastructure (still unlikely but possible), then there would be a need for a new view.

I think we can agree that it is reasonable to fear that the trade in semiconductors has become overcrowded and could become a bubble. That’s the almost universal belief of the fund managers’ recent surveys, with more than 80% saying that semiconductors are the world’s most crowded trade.
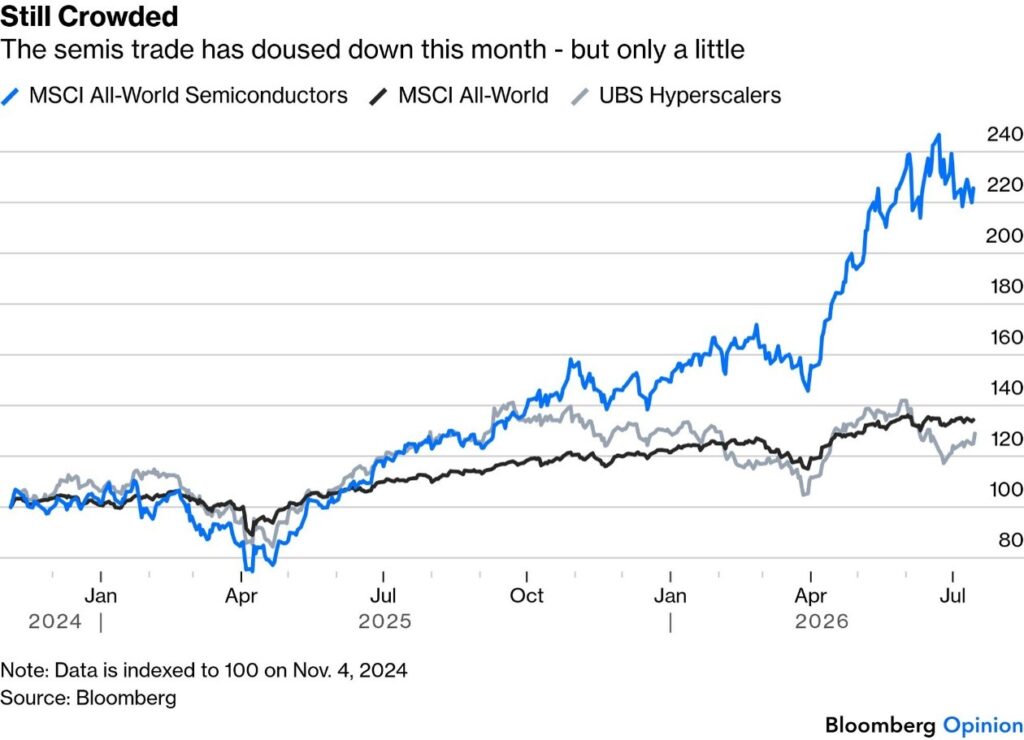
Consider it good news, as the world’s most powerful money managers are aware of the risk. There’s also been some correction this month with MSCI’s index of semiconductors falling while the hyperscalers — their customers attempting to build out data centres to offer AI models — have recovered a little. But the trade remains blatantly crowded.
Sighs of relief are greeting news that inflation abated last month, due partly to falling oil prices. That means lower bond yields and easier monetary conditions, which can be self-fulfilling positive prophecies. Wall Street banks’ results have also confirmed that the strength of the semiconductor trade and the turbulence caused by the oil shock contributed to amazing market conditions. But if those conditions are only easing on the back of faulty assumptions based on backward data, they could contribute to more of a future take-off in inflation. The “no landing” hypothesis, which most fund managers now expect, generally ends with inflation and higher rates — and it’s also generally those higher rates that are needed to end equity bull markets. But that’s still a matter of months in the future.

The dollar is a traditional safe haven for times of geopolitical uncertainty. That’s helped it this year as the Iran war drove a recovery. Now comes a test of its staying power as the structural forces weighing on the greenback look set to reassert themselves.
While the Federal Reserve’s minutes from last month confirmed a hawkish tilt, subsequent inflation data suggest expectations of a more aggressive policy shift may have been overdone. A single month’s data print isn’t enough to indicate a trend, but it calls the dollar’s revival into fresh question.
A strong majority think the dollar is overvalued, which, if anything, implies an expectation that this latest escalation will be short-lived.
A sustained breakout in oil prices could still provide near-term support and put a floor under the currency, even if the broader uptrend has run its course.
Seasonality tends to be quite negative for the dollar in the third quarter, and if we see some steepening in the yield curve… all of those could be near-term headwinds for the dollar. A strong second-quarter earnings season could provide a tailwind. With US banks off to a solid start, HSBC’s Max Kettner argues that the reporting season may prove even more consequential for US assets than the latest inflation data. How much of that strength ultimately feeds through to the dollar is less clear.

Elon – no longer the flavour of the month
“Don’t Believe the Hype” was one of the more memorable anthems of the late ’80s, and it arguably could be again today. This is especially the case for investors in Elon Musk’s rocket-satellite-AI venture SpaceX.
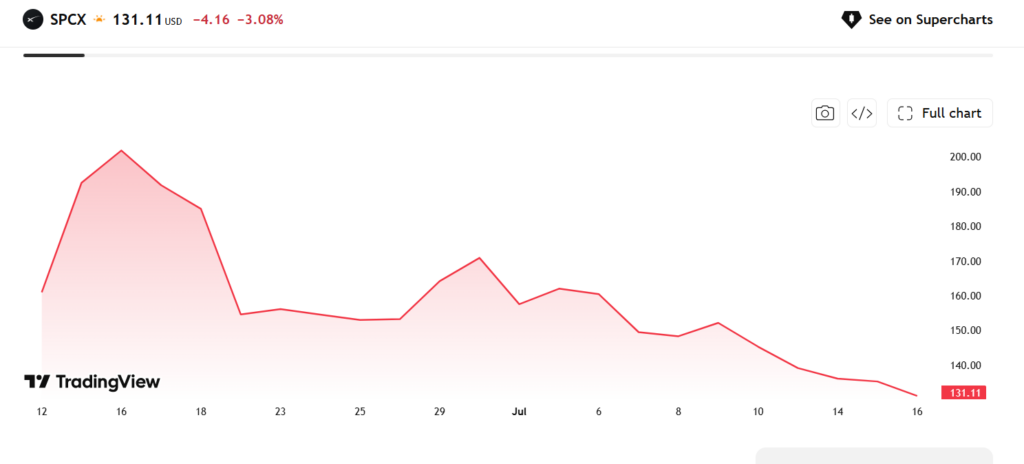
The company’s shares just slumped to their lowest level since it went public. You may recall that breathless splash of Wall Street pandemonium as well as the frenzied media coverage that accompanied it. The stock on Wednesday even briefly fell below its initial offering price.
And there could be more pain ahead. The first of many share lockups that have kept early investors from selling shares are set to expire once SpaceX reports its first set of quarterly results — something it must do soon.
In an interesting new development, New York-based Subversive ETFs (operating under the Tidal Trust I structure) filed with the SEC to launch two actively managed funds that track major indexes while stripping out anything tied to Elon Musk:
– Nasdaq-100 Ex-Elon Enterprises ETF (ticker: QQNE – NE=No Elon)
– S&P 500 Ex-Elon Enterprises ETF (ticker: SPNE)
Both funds will hold at least 80% of their assets in their respective index exposures, redistributing the excluded weight across the remaining constituents rather than sitting in cash.
The initially excluded enterprises are Tesla (TSLA) and Space Exploration Technologies Corp. (SPCX), with the filing leaving room to add other Musk-linked companies later. Neuralink and The Boring Company aren’t included since they’re privately held.
The catalyst was SpaceX’s fast-tracked Nasdaq-100 inclusion, which suddenly forced passive Nasdaq-100 investors to hold it alongside Tesla. Trading is scheduled to begin September 21, 2026 — so these aren’t live yet, still pre-launch.

South Africa’s finance minister said the board of the continent’s biggest money manager briefed the government on a decision to suspend its chief executive officer over alleged governance issues and that it will assess the information after talks with those involved. This is very serious and should be a red flag for any future endeavours by the government to get their grubby paws on large sums of money – the NHI being the biggest example.
The state-owned Public Investment Corp., which oversees $219 billion in South African government pensions, on Monday suspended CEO Patrick Dlamini amid a probe into allegations of impropriety raised in a whistleblower report. The nation’s financial regulator has announced an investigation into governance issues at the fund.
Finance Minister Enoch Godongwana said late Wednesday. “The decision to put the CEO on precautionary suspension was taken by the board — the government is not involved.”
Deputy Finance Minister David Masondo, whose portfolio includes the chairmanship of the PIC, announced Dlamini’s removal earlier this week.
Dlamini’s suspension deepens a sense of crisis at the fund, which has had a revolving door of senior executives over the past decade. The PIC named Chief Financial Officer Batandwa Damoyi as acting CEO on Wednesday.
Godongwana and Masondo — the top two officials in the finance ministry — are at odds over the decision to suspend Dlamini, the handling of a report that he ordered into a controversial investment in a Johannesburg airport, and a whistleblower tip-off that followed, according to people familiar with the matter who asked not to be identified.
There’s also increasing disquiet within the PIC about the number of executives in acting roles and the lack of a CEO, another person with knowledge of the matter said. In addition to suspending Dlamini this week, the PIC board also appointed Leon Smit to replace August van Heerden as acting chief investment officer.
South Africa’s Financial Sector Conduct Authority has become “increasingly concerned” by developments at the PIC and plans to conduct an investigation, it said in a statement late Tuesday.
Dlamini was suspended eight months after ordering an investigation by PwC into a Black economic-empowerment deal linked to an investment in Lanseria, an airport on the northern outskirts of Johannesburg. The report exposed alleged wrongdoing by members of the PIC’s staff, the people said.
A whistleblower report later accused Dlamini of breaching governance limits by ordering the investigation, which led the board to suspend him. Dlamini couldn’t be reached for comment.
The PIC said its board has prioritised strengthening governance and implementing the recommendations of a judicial commission of inquiry in 2020 that recommended sweeping changes to laws governing the PIC after it found senior management flouted internal procedures. Among the commission’s proposals was that the PIC appoint an independent, non-executive chairperson with expertise in financial markets, rather than the deputy finance minister. Some stakeholders are concerned that this specific recommendation hasn’t been implemented.

Many of our clients are in corporate pension and provident funds and get to choose which funds they can invest in. They may also have TFSAs or smaller investments and are at a loss on which funds to pick and how, so I have decided to add this new segment to make that choice easier.
In formal retirement investments, funds need to be Regulation 28 compliant, so as a start in this new series, I will look at the popular “Balanced” sector. All the information is from the Minimum Disclosure Document (aka Fund Fact Sheet) and is available on the providers ’ websites.

There are some investors who like to treat investments as a ‘horse race’, so let’s look at the top and bottom 3 winners and losers over the last 3 years:
Top 3 (3-year annualised return to June 2026, SA MA High Equity, 203-fund peer group)
Bottom 3
Not all those funds are available on every pension scheme, so let’s look at the more popular funds:
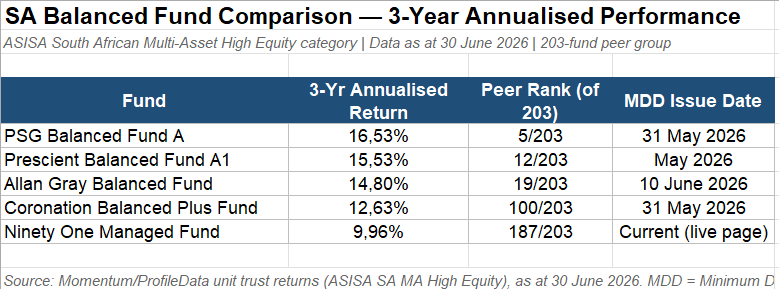
Our Rexsolom Balanced fund, which is a good mirror for our bespoke portfolios, and is also available when investing with us on the Lifecycle platform, had a 3yr annualised return of 16,5% (MDD available on request).
The Balanced” category average was 12,6% annualized over 3 years.
The benchmark for Balanced funds is usually CPI plus 4, in the last 3 years, CPI is at 4,53%, so the benchmark return is 8,53%. So, while it may not feel like it, we have been enjoying above-average returns – thanks in a large part to getting inflation under 5%, and until the oil shock from the Trump War, was starting to close in on 2%(2,7% in March 2025).
So how do you choose? You might think that cost should factor into your choice – but performance is net of fees, so we’re still looking at apples for apples. Look long-term; find a fund or two in the top quartile over 5 years. (Retirement funds are long-term investments.) Look at consistency (the top-performing fund above, for example, had the following returns: 2025: 26.3%, 2024: 10.6%, 2023: 17.1%, 2022: -3.3%) One of the differences with this top performer, while reg 28 compliant, they have the full 45% offshore exposure, which, when combined with the volatile exchange rate has been behind their volatility.

Explainer 1: “Peak Liquidity”
You have probably heard this phrase used recently to describe the US stock markets – but what is it? Peak liquidity refers to the idea that the flow of money supporting asset prices (central bank balance sheets, bank credit growth, money market flows, share buybacks, and so on) has stopped accelerating and may be starting to plateau or reverse.
Liquidity drives multiples, not just earnings: Stock prices are a function of earnings and investors are willing to pay for those earnings. Excess liquidity in the system, cash sitting in money markets, easy credit, and low real rates tend to push that multiple higher because there’s more capital chasing a similar pool of assets. When liquidity growth peaks and starts to flatten or roll over, that support for multiple expansion fades even if earnings keep growing.
In short: When liquidity rises, markets tend to find support, and when it falls, even strong economies can see momentum fade.
It’s a rate-of-change story, not a cliff. The concern isn’t that liquidity turns negative overnight. It’s that the second derivative changes, the pace of new liquidity entering markets slows. Markets are forward-looking, so they often start pricing in that deceleration before it’s fully visible in the data, which is what “capping upside” means in practice: rallies stall or narrow rather than reverse outright.
Why can it coexist with still-decent headlines? This is often the trickiest part for commentary. Markets typically don’t peak on visible fear or deterioration; they peak when liquidity expectations, market euphoria and a weakening business cycle converge. So you can get a period where indices are still grinding to new highs, sentiment feels fine, but under the surface, credit conditions are tightening, buyback pace is slowing, or central bank balance sheet growth is decelerating, and that’s the “signs of peak liquidity” a commentator would be pointing to as a cap on further gains rather than an imminent selloff signal.
What do analysts typically point to as evidence?
• Central bank balance sheet trends (QT pace, reserve levels)
• Bank lending standards (tightening surveys)
• Money market fund flows versus equity fund flows
• Credit spreads widening from tight levels
• Repo market stress or funding cost signals
There are some indications that a peak in US liquidity may be forming towards year-end 2026 or early 2027.
Energy remains the key macro risk, but for now the inflation backdrop is improving.
Explainer 2: “Momentum Trade”
If you read our newsletter last week and listened to the podcast, you’d have heard Cobie explaining the importance of the Momentum Trade in current investments. Momentum in equity markets is the tendency for stocks that have performed well recently to keep performing well in the near term, and for stocks that have performed poorly to keep underperforming, at least for a while before eventually reversing.
It’s one of the most well-documented anomalies in finance: ranking stocks by their trailing returns (commonly the past 3 to 12 months) and buying the winners while shorting or avoiding the losers has historically produced excess returns, even though it contradicts the simplest version of efficient markets theory (where past price moves shouldn’t predict future ones).
In a way, the opposite of this is the ‘value trade’ (which Cobie wrote about in last week’s newsletter)
Why does this happen?
Momentum is treated as a factor, similar to value, quality, or size, that can be isolated and traded.
Author: Dawn Ridler

I have vivid memories of the last commodity super-cycle leading up to the 2008 financial crisis. In 2005, 2006 and 2007, Resource shares in South Africa had stellar returns, outpacing their Financial and Industrial counterparts. The returns were driven by an insatiable desire for commodities by the Chinese as they were building out an economy which needed serious attention if they were going to compete on the world stage.
| Year | Resources | Industrials | Financials |
| 2005 | 71.5 | 35.5 | 34.7 |
| 2006 | 44 | 41.9 | 35.8 |
| 2007 | 29.1 | 17.8 | 3 |
But this was late-stage investing as 2008 held the start of the subprime crisis, and with this went returns in all asset classes. In 2009, there was a recovery but for the next 6 years, Resource shares shed their lustre to record worse returns than Financials and Industrials
| Year | Resources | Industrials | Financials |
| 2008 | -28.3 | -16.1 | -26.2 |
| 2009 | 35.4 | 30.5 | 28 |
| 2010 | 12.3 | 27.4 | 16.6 |
| 2011 | -6.5 | 9.2 | 7.4 |
| 2012 | 3.1 | 40.7 | 38.1 |
| 2013 | 1.4 | 35 | 19.1 |
| 2014 | -14.7 | 16.8 | 27.3 |
| 2015 | -37 | 15.3 | 3.9 |
To predict the next super-cycle or when they are going to perform is impossible. Managers that did not own Resources leading up to the 2008 crisis were sorely left behind but many of them were vindicated in the ensuing years.
So why not just include them in a portfolio?
Fundamental investors battle to do this. They will point out to the cash hungry nature of their assets and that many of them are lost in a wilderness of assessing new projects and maintaining existing ones whilst hoping for rising commodity prices. This uncertain environment causes many miners to fall short of what investors hope for: predictable cash flows. Ignoring commodities have a second effect as well. Resources make up 30% of the local market. That is a large chunk of the market to be ignoring when prices are going up. It also places a heavy burden on stock selection as managers are forced to not only get their selection but also their weighting in other counters perfectly right. This is near impossible to do.
So this now leaves active managers with a conundrum. There are 2 factors that are impossible to get right all the time, and both are competing for portfolio returns. The one is the direction of commodity prices (and the Dollar in which commodities are priced) and secondly the selection and weighting of non-commodity counters in a portfolio. In a world where money managers want to add certainty to their fund returns, these are 2 large risks which is almost uncontrollable in the short term and can heavily influence portfolio returns. But over the longer term, there is the following picture which emerges:
| Year | Resources | Industrials | Financials |
| 3 years | 35.2 | 17.7 | 23.5 |
| 5 years | 29.3 | 15.2 | 21.4 |
| 10 years | 26.4 | 9.5 | 10.5 |
| 15 years | 14 | 14.1 | 13.4 |
| 20 years | 15.1 | 15.7 | 12.9 |
(Dated to Dec 2025)
For periods shorter than a decade, commodity shares are the clear winner.
This is driven by the 126% gain in 2025 as the world started stockpiling Gold again off the back of global debt monetisation. Up to the beginning of 2026, there was still debate about whether gold is the right hedge to use, but the rise in gold prices tells the whole story. Debt monetisation is here to stay, and so are low interest rates, as this is the only way for governments to enable this. This should at least provide net buyers of commodities for the mid-term future.
If one looks at the returns for these sectors over 15 and 20 years, all of the returns actually look quite similar. So over the long term, portfolio diversification across all three sectors would have equally aided returns. There is a case to be made that Resource companies are more volatile than their counterparts. This is true, but if one controls the allocation to these, this shouldn’t meaningfully add to overall portfolio volatility. And then there is a case to be made that analysing and picking Resource shares fall outside the skill set of a manager who has been trained to understand the price to be paid for predictable cash flows. The easy answer is that including the Resources ETF takes the underlying company analysis away. Active managers will then have to be seen, including an ETF in an actively managed portfolio. This in the past was a no-go area for most active asset managers. I would argue that, given the wide array of ETFs available today, these should be seen in the same light as company shares. They are tools to be used to increase the value of assets over the long term, and if they assist in managing the risk for getting to the end goal…. Why not?
Author: Cobie Le Grange
EXCHANGE RATES and other Indices:
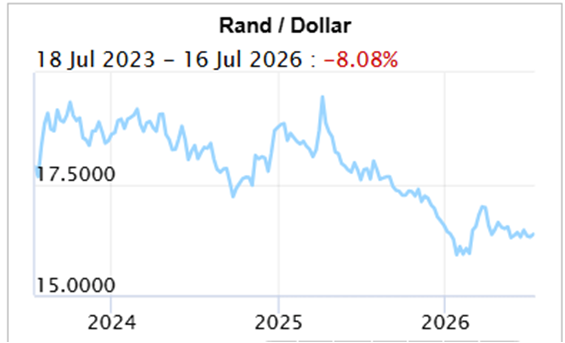
The Rand/Dollar closed at R16.47 (R16.31, R16.22, R16.40, R16.39, R16.27, R16.55, R16.23, R16.46, R16.68, R16.39, R16.63, R16.29, R16.41, R17.07, R17.06, R16.89, R16.55, R15.93, R16.01, R15.96, R16,03, R16.15, R16.10, R16.50, …R16.91, R17.13, R17.36, R17.13,16.52 )
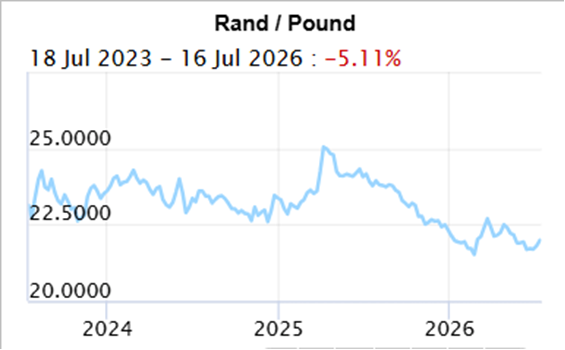
The Rand/Pound closed at R22.16 (R21.86, R21.64, R21.64, R21.67, R21.80, R22.06, R21.80, R22.09, R22.21, R22.30, R22.56, R22.35, R22.02, R22.09, R22.77, R22.76, R22.35, R22.20, R21.48, R21.59, R21.78, R21,82, R22.11, R21.97, R22.13, …R22.57, R22.68, R22.74, R22.56,

The Rand/Euro closed the week at R18.84 (R18.62, R18.52, R18.66,R18.89, R19.16, R19.08, R18.91, R19.11, R19.38, R19.29, R19.48, R19.37, R19.17, R19.24, R19.70, R19.77, R19.33, R19.23, R18.80, R18.87, R18.94, R18.93, R19.14, R19.04, R19.20)
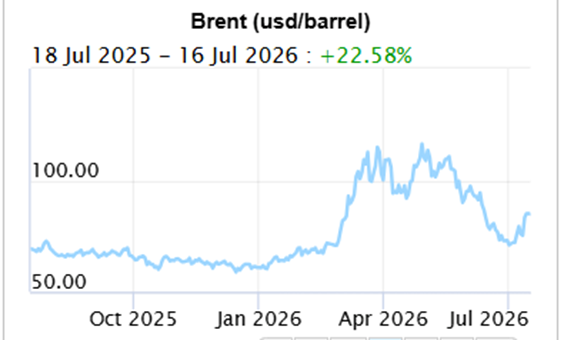
Brent Crude: Closed the week $88.10 ($76.01, $72.10, $71.99, $80.59, $87.33, $93.09, $91.12, $104,24, $109.26, $101.29, $108.83, $105.33, $90.38, $95.20, $107.88, $112.36, $103.14, $92.88, $73.19, $71.76, $67.75, $68,05, $69.32, $65.88, $63.34, …$63.71, $63.19, )
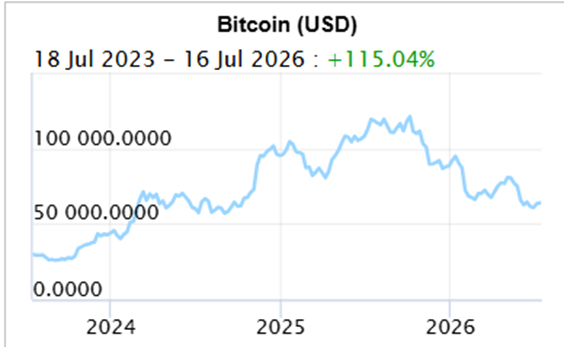
Bitcoin closed at $64,718 ($63,815, $62864, $60,063, $64,029, $64,131,$60,762, $73,788, $74,559, $77,879, $80,733, $78,204, $78,049.98, $75,519, $70,904, $68,691 , $68,586, $70,869, $67,310, $63,534, $68,04, $69,649, $68,553, $81,301, $89,295, $90,585,)
Articles and Blogs:
Investment series part 1 (NEW)
Investment series part 2 (NEW)
Legacy Series Part 4
Legacy Series part 3
Legacy Series Part 2
Legacy Series Part 1
Holiday checklist
Next year – Action Plan
Next year – Vision, Mission etc
Medical Risk Mitigation
Next Year – Consolidation
Abdication or diversification?
Carbo-loading your retirement Spoiled for choice
Who needs a plan anyway
8 questions you need to ask about retirement
What to do when interest rates drop
How to survive volatility in your investments
What to do when interest rates drop
Difficult Financial Conversations
Financial Implications of Longevity
Kick Start Your Own Retirement Plan
You matter more than your kids in retirement
To catch a falling knife
Income at retirement
2025 Budget
Apportioning blame for your financial state
Tempering fear and greed
New Year’s resolutions over? Try a Wealth Bingo Card instead.
Wills and Estate Planning (comprehensive 3 in one post)
Pre-retirement – The make-or-break moments
Some unconventional thoughts on wealth and risk management
Wealth creation is a balancing act over time
Wealth traps waiting for unsuspecting entrepreneurs
Two Pot pension system demystified
Cobie Legrange and Dawn Ridler,
Rexsolom Invest, Licensed FSP 45521.
Email: cobie@rexsolom.co.za, dawn@rexsolom.co.za
Website: rexsolom.co.za, wealthecology.co.za