If you’d like the ‘Pocket Tax Guide’ on the tax changes announced in the budget, just let me know or download it HERE.
The new escalation of the Middle East conflict is unfolding as we write this, and we have gone into it in a little more detail on the podcast that went out last night, but from a market and economic portfolio, we expect markets to react Monday morning, and oil is probably going to be squeezed higher, but it is too early to make any predcitons let alone portfolio changes.

Your summary with links, if you’d like to curate your content:

This Week’s Roundup
RSA
South African markets spent the week digesting the 2026 Budget and softer inflation, with the rand broadly steady and local assets reacting more to domestic policy than global moves.
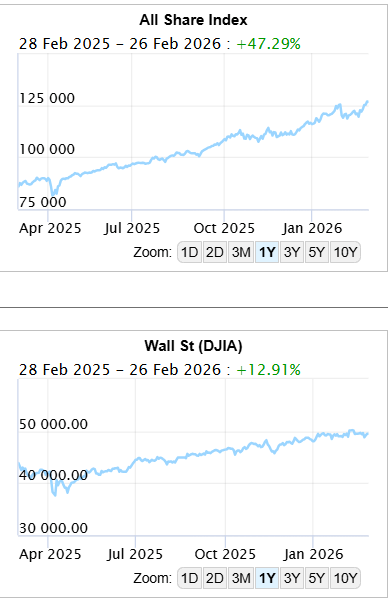
Finance Minister highlighted a “turning point” for public finances with debt expected to peak and then decline, aided by strong commodity prices, improving growth forecasts and a more investor-friendly narrative.
USA Markets & Economy
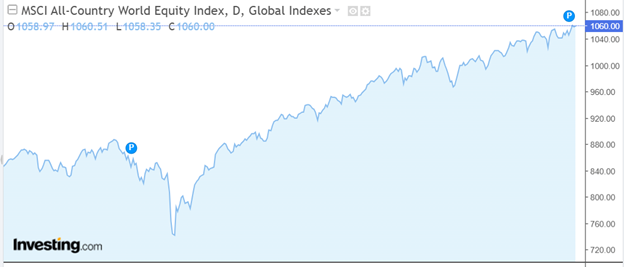
Global ex RSA/USA

Finance Minister Enoch Godongwana’s 2026 South Africa Budget Speech, delivered February 25, 2026, marks a “fiscal turning point” with debt stabilising after 17 years of rises, improved revenue forecasts enabling no broad tax hikes, and a focus on growth via reforms in energy, logistics, water, and local government.
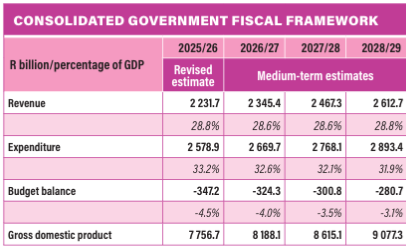
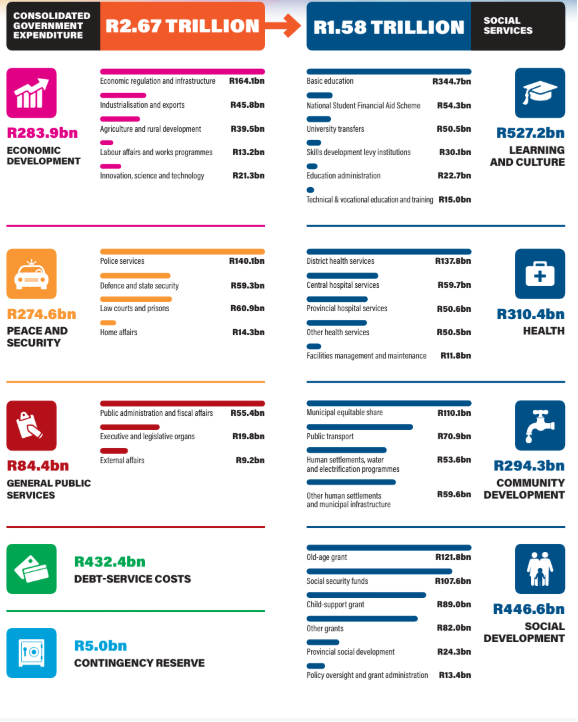
Total consolidated spending hits R2.67 trillion in 2026/27 , with social wage >60% of non-interest outlay, while R12bn in targeted savings reallocate to high-impact areas like the judiciary and borders.
Economic Outlook: Real GDP growth estimated at 1.4% for 2025 (up from 0.5% in 2024), 1.6% in 2026, averaging 1.8% medium-term to 2% by 2028, driven by reforms, lower rates, and investment momentum.
Inflation at 3.2% (2025) to 3.4% (2026), with global growth at 3.3% amid trade shifts favouring diversification into Africa. Key drivers are energy stability, logistics fixes (e.g., Transnet rail to 77mt coal/60mt iron ore), and private investment; risks include logistics bottlenecks and foot-and-mouth disease.
Fiscal Strategy and Framework:

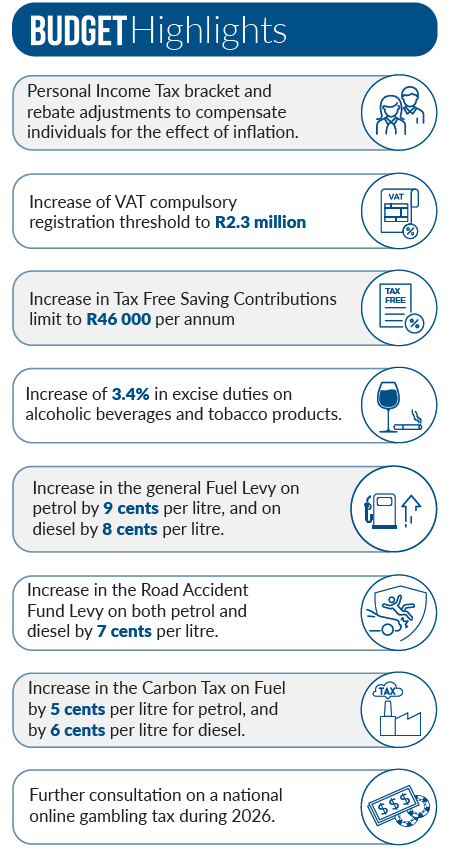
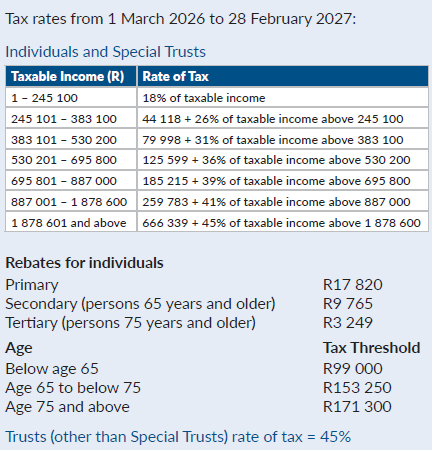
Tax Proposals (Key Changes)
Personal Income Tax (PIT): Full inflation adjustment to brackets/rebates/medical credits (after 2 years without); no bracket creep.

Social Grants and Protection
Grants up 26.5m (R292.8bn). Old age/disability/care dependency +R80 (April) to R2,400; war veterans to R2,420; foster care from R1,290 to R1,300; child support/grant-in-aid +R20 to R580. SRD (Social Relief Distress, aka COVID grant) continues; R3bn savings from fraud targeting (35k grants cut). HIV/AIDS R26bn; social wage supports 13.6m pupils, 84% healthcare access.
Key Spending Allocations (2026/27)
Reforms and Infrastructure
The budget prioritises growth (2% target), efficiency, and inclusivity while leveraging revenue strength for relief and reforms.

President Donald Trump delivered his first State of the Union address of his second term on February 24, 2026, lasting a record 1 hour 47 (move over Castro) minutes while hailing a “historic turnaround” and “golden age of America” after one year in office.

Major Themes
Trump framed his presidency as one of reversing prior “stagnant” conditions, boasting of secure borders, a booming economy, falling inflation, rising incomes, and global respect, declaring “the state of our Union is robust.” He emphasised America First policies, with showmanship including guest spotlights and base appeals on immigration, fraud, and crime.
Key Highlights
The fact-checked version
President Donald Trump’s 2026 State of the Union address drew extensive fact-checks from outlets like CNN, NBC, BBC, DW, and NPR, disputing numerous claims on the economy, immigration, fraud, and foreign policy as exaggerated, misleading, or false.
Economy and Investments
Immigration and Crime
Elections and Fraud
Foreign Policy
Other
Fact-checkers noted many claims recycled from rallies/social media, with the speech’s length amplifying.

Inflation is bad, so deflation is good?
US President Donald Trump has often said that prices overall in the US have fallen since he began his second term in January, a message he repeated at his Feb. 24 State of the Union address. That’s not quite right, nor would he want it to be.
It would be a difficult message for a US president to deliver to a public that is feeling squeezed financially and tell them that inflation is “actually good for you”. They just want things to go back to costing what they used to.
The truth is a little bit of inflation is actually good for the economy, whereas a drop in prices overall is typically a dangerous sign.
Some prices rise and fall seasonally or cyclically – vegetables, beef, oil, in other words, commodities. Prices generally aren’t actually falling in the US, as Trump says they are. In fact, prices are rising at roughly the same rate, about 3%, that they were a year ago, making living costs a lingering political liability for the president and his Republican Party.
Affordability was one of the main issues that propelled Trump to victory in the 2024 election. Voters, frustrated with seeing their wage gains swallowed up by rising costs, were drawn to his promise of bringing down grocery prices on day one. But a year into Trump’s second term, people remain concerned about the cost of living.
Trump has at times downplayed the issue: After Republicans lost high-profile races last November where pocketbook issues were front and centre, he called affordability a “hoax.” In many recent polls majority of Americans disapprove of how Trump is handling inflation and the economy.
What’s the difference between prices coming down and inflation coming down?
The confusion lies in the distinction between inflation, which measures the rate at which prices are rising, and the price levels themselves. The cooldown in inflation from the decades-high levels seen after the pandemic means that prices are still going up, just at a slower pace than before.
Prices, however, are still significantly higher for many goods and services than they were several years ago. Grocery prices are up about 30% since January 2020. Day-care costs are 39% higher than they were in 2019. A new car now costs close to $50,000 on average, leading more buyers to take out longer loans. That helps to explain why so many people are still struggling financially.
The Federal Reserve and other policymakers have been working to promote disinflation, a scenario where prices are still rising but more slowly. This is not the same as deflation. The US central bank boosted interest rates in the aftermath of the pandemic to cool the economy and rein in price increases. It has lowered rates over the past year and a half to backstop the labour market, but officials remain worried that inflation could stay elevated.
There has been progress. The Fed’s preferred gauge of inflation, the personal consumption expenditures index, increased by 2.9% in the year through December, down from 7% in 2022. But it’s higher than the 2.7% seen at the end of 2024, suggesting progress stalled during the first year of Trump’s second term.
Why is a little inflation good for an economy?
Economists and policymakers say it’s generally good to aim for some low level of inflation above zero. While inflation that’s too high can be troublesome, a decrease in prices, known as deflation, can be much worse, as businesses and consumers delay purchases on the expectation that prices will fall further. Additionally, when inflation is above zero, employers can reduce their payroll costs by keeping wages and salaries flat, or just by handing out annual raises that are below inflation. Companies do that at their peril when the economy is strong because they can lose workers seeking better pay. But during a downturn, workers can benefit as it allows employers to reduce costs without laying people off. As a result, economists believe that having some inflation can reduce unemployment spikes during recessions. Low inflation can also be a healthy sign that people are spending and businesses are expanding. But the key is for inflation to remain low and stable. The Fed targets an inflation rate of 2%, which it views as a level that leaves businesses and consumers feeling like they can confidently plan for the future.
That’s not the sentiment that reigned after the pandemic, when prices soared so rapidly that they outpaced any income gains people might have been seeing. People and businesses faced sticker shock, and the cost of living became a top issue for most consumers, as it still is today.
Why is deflation bad for an economy?
Deflation occurs when prices for goods and services fall across the economy, increasing money’s purchasing power but often sparking a harmful downward spiral. People delay purchases, expecting even lower prices later, slashing consumer spending and stalling business revenues. Firms cut production and jobs to survive, hiking unemployment, which further curbs demand and drops prices more—a self-reinforcing “deflationary spiral” that can lead to recession or depression.
Key Effects
Debt burden rises: Fixed loans become harder to repay as wages/incomes fall while debt values hold steady (or effectively grow in real terms).
Business failures: Profits shrink, forcing layoffs, reduced investment, and bankruptcies; credit tightens as banks fear defaults.
Wage cuts: Employers slash pay to match lower prices, leaving workers with less to spend.
Real-World Examples
A drop in prices can feel good for consumers’ pocketbooks because it helps people’s dollars go further. But an overall decline in prices, known as deflation, typically only happens when the economy is weak or contracting.
In that scenario, households might have stronger purchasing power, but it is likely to be accompanied by job losses, companies and consumers pulling back and other recessionary shifts. When people expect things to cost less in the future, they hold off on big purchases, which can worsen the spiral by further weakening growth.
Something akin to this is taking place in China, where a real estate slowdown and tighter regulations on technology and finance firms have led to layoffs and a pullback in spending.
Why is inflation so persistent in the US?
While inflation has come down significantly from the peak seen in 2022, progress has been slower over the past year or so. Projections from Fed officials show they expect inflation to return to their 2% target by 2028, a timeline that has been repeatedly pushed back.
Some of the persistent upward price pressures are related to how the increases are measured. Housing costs, for example, take a notoriously long time to filter through to official inflation data because leases are typically renewed only once a year, leading to delays in how those trends reach consumers compared with prices for goods and services that are revisited more frequently. Trump’s tariffs also played a role last year by raising prices for goods subject to the levies. But uncertainty over the scale of the tariffs and frequent policy changes has muddied the outlook for how the taxes will ultimately affect prices.

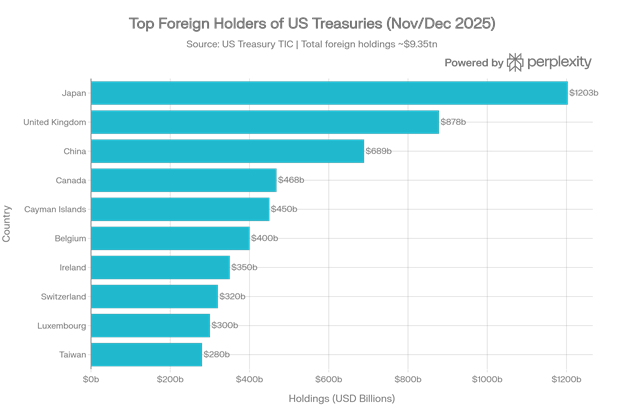
US Treasuries – how ownership is shifting
The US is becoming ever more dependent on its closest allies to fund its swollen debt burden, exposing a vulnerability in the $30 trillion Treasuries market.
Countries that are aligned with Washington bought $463.9 billion of Treasuries in 2025, the biggest annual net purchase since at least 2016, according to Bloomberg’s analysis of US Treasury data. The figures also showed that countries least united with the US offloaded the most American debt in six years.
Non-allies and neutral nations sold $673 billion of Treasuries between 2016 and 2025.
The pivot away from US government bonds has gained momentum as President Donald Trump’s unpredictable decision-making rattles investors, even though most market participants say US debt is likely to remain the world’s benchmark safe asset.
While alignment can be subjective, in this analysis, countries were classified as most-, least- and neutrally-aligned by looking at their voting behaviour at the United Nations and seeing whether or not it tallied with the US. The assumption is that countries that vote the same way are more closely aligned, and it’s an approach commonly used in academia to determine allies and adversaries.
For example, long-time military ally Australia was classified as most-aligned, China as least, with America’s neighbour Mexico falling into the neutral bucket. The votes examined were those on key UN resolutions, based on data from the US Department of State.
The concentration of holdings in the hands of foreign investors shows where the balance of power lies, and suggests that Trump can ill-afford to alienate his allies even as he seeks to reshape the world order. His push to gain control of Greenland last month sparked a flurry of speculation that Europe might push back by “weaponising” those holdings and dumping them.
In light of the use of sanctions, tariffs, rising deficits and general ‘America first’ policies, it’s not surprising that some countries are reducing dollar exposure.
The UK, Canada and Japan bought the most Treasuries last year, according to the data from the US Treasury, although the UK figures may have been distorted by its role as a financial hub. China, India and Brazil sold the largest quantities of the notes, with Belgium, whose holdings are usually taken to include some Chinese accounts, ranking just behind them.
Even if the UK and Belgium are excluded, US allies were still net buyers, with their purchases exceeding 2024 levels.
The shift away from dollar-denominated assets has gained traction amid Trump’s attack on the Federal Reserve’s independence, escalated trade wars and widening political polarisation. But the US president has also long accused other countries of seeking weaker exchange rates to boost exports, suggesting the US currency was unfairly overvalued.
With ownership of roughly a third of all outstanding Treasuries resting in the hands of foreigners, the risk is that more countries may join the likes of China, India and Brazil in scaling back their dollar exposure if they’re unsettled by Washington’s policies.
As long as US yields remain relatively attractive, which seems likely with investment and productivity boosting the neutral rate, capital should continue to flow into Treasuries.
Earlier this month, Chinese regulators were said to have advised financial institutions to rein in their holdings of US Treasuries, citing concerns over market volatility. This came after Europe’s biggest pension fund spent much of last year dramatically trimming its exposure to the securities.
While there are no signs this is imminent, and demand can be influenced by a range of factors, a flight from Treasuries could drive up yields and put pressure on Washington’s financing needs.
The price action in the aftermath of Trump’s sweeping global tariffs imposed in April 2025 provides a snapshot of the chaos that could ensue if US yields suddenly surge: back then, a gauge of Treasuries’ implied volatility soared to its most extreme level since late 2023, currency fluctuations jumped to the highest in two years, and the VIX index of equity volatility reached an eight-month high.
But some say that the concerns are overstated. While overseas investors’ holdings of Treasuries excluding bills hit a record high in November, they accounted for just a third of the outstanding amount, down from a peak of 52% in 2012. That means the US’s allies and rivals both have arguably less leverage in aggregate than over the past decade.
Treasuries also remain the world’s benchmark safe asset, and the higher yields offered by the notes — around 4.05% on 10-year debt — help burnish their appeal. The bonds delivered a return of over 5% in the past 12 months to outperform most of their developed-market peers.
There just aren’t large alternatives to the US market. Even if investors feel some frustration toward America, it’s not practical to shift capital somewhere else.
Treasury Secretary Scott Bessent has regularly pushed back against the “sell America” rhetoric, arguing that the administration’s economic policies enhance the US’s position as the top destination for global capital.
Beyond China, some market participants say the broader pivot away from US assets is set to continue, even though pockets of interest remain. Foreign net purchases of US stocks more than doubled to $717 billion in 2025, while the buying of corporate securities and other bonds hit the highest level since at least 2016.
Foreign official holdings of Treasuries have declined about 12% from their peak in 2021 to $3.5 trillion. In contrast, gold reserves hit a record, according to data from the US Treasury and International Monetary Fund.
This somewhat ‘boring’ side of investing continues to be uncomfortably interesting.
Author: Dawn Ridler

Last week, I looked at the growth assumptions of AI companies and why history suggests some of their claims are outlandish. I made the point then that Capex expenditure will have to start delivering returns; not doing so will show that management could have spent the capital more wisely elsewhere. Jurrien Timmer from Fidelity has looked at the Capex cycle for the S&P500 and shows it in the following graph:
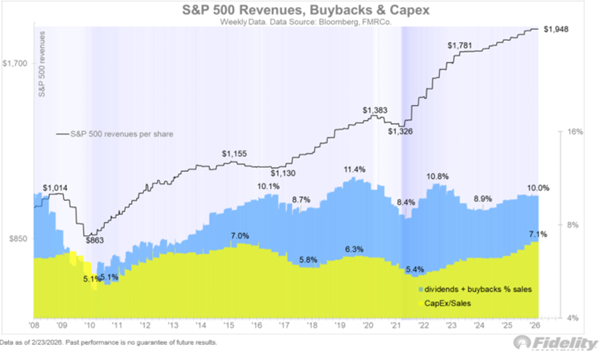
The black line shows the S&P 500 Revenue per share through time. Revenue was at $1,326 in 2022, and this has now grown to $1,948. That shows Revenue increasing by 11.7% per year. In essence, the S&P500 is becoming 12% more valuable on a yearly basis, which means that this will translate into share prices going up. The problem for equity investors is that share prices can detach from the increase in business value from time to time. It is in this detachment that markets offer either value or exuberance. The term irrational exuberance was coined by Robert Shiller in a book by the same name in 2000, and explores this concept, including its other side, irrational pessimism. It’s the emotional side of investing that drives our behaviour, not the numbers. But if one is aware that companies are living entities constantly seeking opportunities to drive greater efficiency and higher profits, buying and holding equities becomes much easier. This is no different today, despite the advent of AI.
The graph also shows dividends and share buybacks as a percentage of Revenue. In 2022, this was at 8.4% and has subsequently grown to 10% of Revenue. Shareholders love dividends and share buybacks, as they make them directly wealthy without having to exercise patience. Dividends you receive as cash, and large shareholders can live successfully off their dividend cheques. Share buy-backs, on the other hand, are a vote of confidence by management that they see value in the current share price. The benefit to shareholders is that the number of shares in circulation reduces, making the company more valuable.
And then there is Capex, which is management’s promise on the future.
It’s the capital that companies are dedicating to new assets to ensure that they can drive Revenue higher in the future. In 2022, this was at 5.4% of revenue, whereas in 2025 it climbed to 7.1%. This isn’t impeding on the dividend and share buy-back rate yet, but it is well worth noting that the increased percentage is on an increasing Revenue line. Once this is considered, companies in the S&P500 have been spending 23% p.a. more on CapEx since 2022, whereas Revenue has grown at a rate below that at 12%. And this is the point analysts are making.
But despite the short-term disconnect, remember that these companies are becoming more valuable every day. No one knows if the CAPEX cycle will result in an increase in Revenue but what we do know is that companies will adjust to reflect another reality should that be necessary. That is the beauty of owning companies and why they are the main long-term growth drivers of portfolio returns.
Author: Cobie LeGrange
EXCHANGE RATES and other Indices:
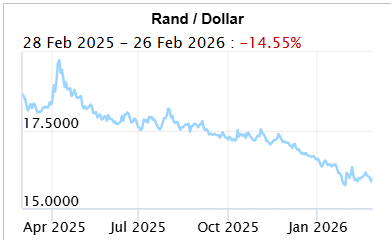
The Rand/Dollar closed at R15.93 (R16.01, R15.96, R16,03, R16.15, R16.10, R16.50, …R16.91, R17.13, R17.36, R17.13, R17.27, R17.31, R17.25, R17.38, R17.50, R17.22 , R17.35, R17.33, R17.37, R17.58, R17.65, R17.44, R17.61, R17.74, R18.15,R17.76, R17.72, R17.90, R17.58, R17.89, R17.99, R17.92, R17.77, R17.95, R17.88)
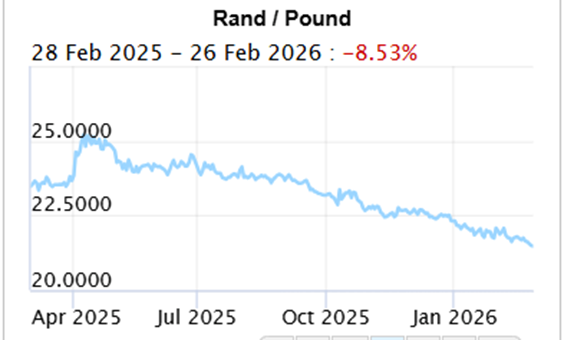
The Rand/Pound closed at R21.48 (R21.59, R21.78, R21,82, R22.11, R21.97, R22.13, …R22.57, R22.68, R22.74, R22.56, R22.69, R22.76, R22.96, R23.34, R23.37, R23.19, R23.22, R23.35, R23.55, R23.73, R23.84, R23.53, R23.84, R23.84, R24.09, R23.88, R23.76, R24.22, R24.08, R24.49, R24.22, R24.35, R24.05, R24.18)
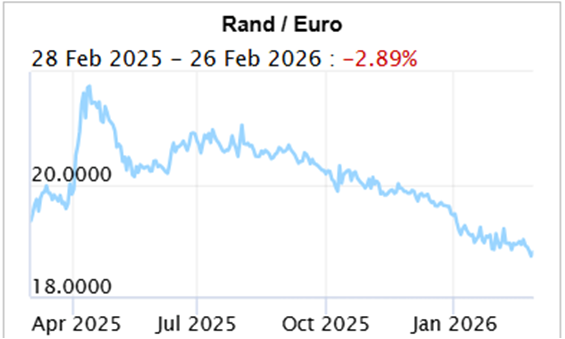
The Rand/Euro closed the week at R18.80 (R18.87, R18.94, R18.93, R19.14, R19.04, R19.20, …R19.68, R19.86, R19.99, R19.96, R19.98, R20.02, R20.06, R20.26, R20.33, R 20.22, R20.30, R20.35, R20.38, R20.61, R20.62, R20.44, R20.56, R20.64, R21.04, R20.86, R20.61, R20.93, R 20.70, R20.91, R20.74, R20.68, R20.24, R20,37)
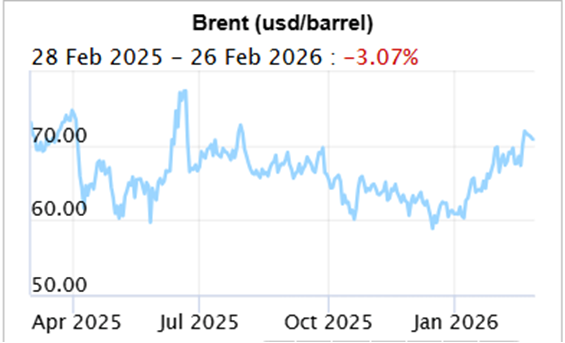
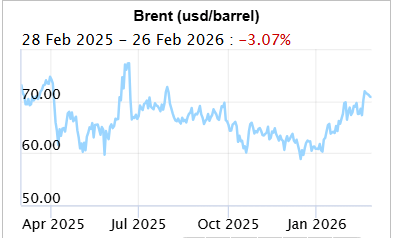
Brent Crude: Closed the week $73.19 ($71.76, $67.75, $68,05, $69.32, $65.88, $63.34, …$63.71, $63.19, $62.42, $63.94, $63.61 $64.66, $65.04, $61.27, $62.14, $64.28, $69.67, $66.57, $66.80, $65.52, $67.38, $67.73, $66.08, $66.07, $69.46, $68.29, $69.21, $70.58, $68.27, $67.39, $77.27, $74.38, $66.56, $62.61, $65.41)
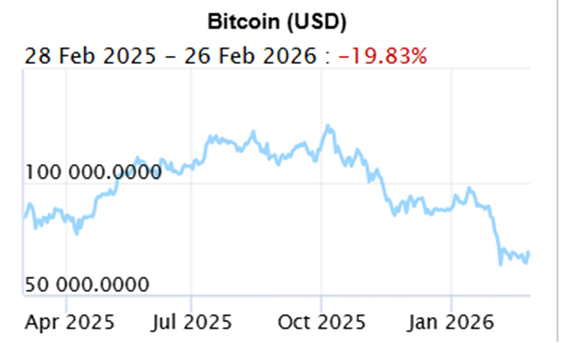
Bitcoin closed at $63,534 ($68,04, $69,649, $68,553, $81,301, $89,295, $90,585, … $90,809, $86,334, $94,990, $101,562, $109.936, $112,492, $106,849, $111,888, $124,858, $109,446, $115,838, $115,770, $110,752, $108,923, $114,916, $117,371, $118,043, $113,608, $118,139, $118,214, $117,871, $108,056, $107,461, $103,455)
Articles and Blogs:
Holiday checklist NEW
Next year – Action Plan NEW
Next year – Vision, Mission etc NEW
Medical Risk Mitigation
Next Year – Consolidation
Abdication or diversification?
Carbo-loading your retirement Spoiled for choice
Who needs a plan anyway
8 questions you need to ask about retirement
What to do when interest rates drop
How to survive volatility in your investments
What to do when interest rates drop
Difficult Financial Conversations
Financial Implications of Longevity
Kick Start Your Own Retirement Plan
You matter more than your kids in retirement
To catch a falling knife
Income at retirement
2025 Budget
Apportioning blame for your financial state
Tempering fear and greed
New Year’s resolutions over? Try a Wealth Bingo Card instead.
Wills and Estate Planning (comprehensive 3 in one post)
Pre-retirement – The make-or-break moments
Some unconventional thoughts on wealth and risk management
Wealth creation is a balancing act over time
Wealth traps waiting for unsuspecting entrepreneurs
Two Pot pension system demystified
Cobie Legrange and Dawn Ridler,
Rexsolom Invest, Licensed FSP 45521.
Email: cobie@rexsolom.co.za, dawn@rexsolom.co.za
Website: rexsolom.co.za, wealthecology.co.za