Your summary with links, if you’d like to curate your content:
Taking it on the chin: It’s Still About Earnings
Equities are holding up because earnings expectations haven’t cracked—yet. If the war drags on, downgrades follow, and markets lose their main support.
Can US Consumers Keep Buying?
Consumers are under pressure from rising fuel costs, high interest rates, and shrinking savings. Weak spending momentum suggests the US economy was already slowing before the war.
RSA – How the Oil Shock Will Affect Us
Fuel price hikes will push inflation higher and likely feed into interest rate pressure. South Africa’s recent low-inflation environment is at risk of reversing quickly.
Data Centres and Water
AI-driven data centres are straining water and energy resources, especially in arid regions. New cooling technologies could dramatically reduce usage, and even turn waste heat into water.
A “Do-Nothing” FOMC
The Fed held rates but signalled deep uncertainty tied to oil and geopolitics. Markets reacted negatively as expectations for rate cuts dropped sharply.
US Inflation
Inflation pressures are rebuilding due to energy shocks, tariffs, and supply constraints. The 2025 commodity surge continues to feed into persistent price pressures.
When Markets are RED
Markets have sold off sharply, with SA resources hit hardest despite higher commodity prices. Volatility is creating opportunities—but only for investors willing to look past the noise.

This Week’s Roundup
RSA
USA Markets & Economy
Global ex RSA/USA

Taking it on the chin : It’s Still About Earnings
Despite the fact that the war in Iran is far from over, there are some signs that the ‘tether’ between oil and stock prices is loosening somewhat.
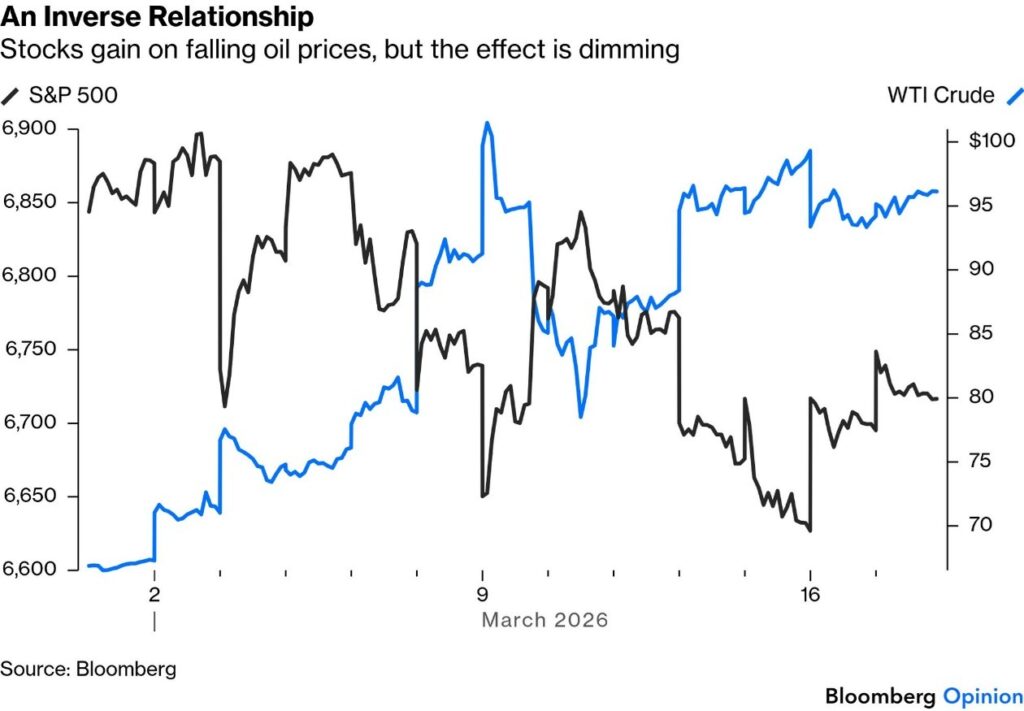
Stock markets have obviously raised the risk premia in response to the conflict, as is only sensible, but not in any way that’s excessive or presents big opportunities for contrarians. since the war’s outbreak on Feb. 28, nothing has made money, but the pain has been least for conservative strategies such as low-volatility and high dividend-yield.
The attack (excursion as DJT calls it) came as a surprise three weeks ago. At that time, most in the markets would have expected hostilities to be wrapped up by now. Certainly, few would have predicted that by mid-month, President Donald Trump would beg NATO for military help and be rebuffed. They would have regarded this as very negative.
You’ve probably heard Article 5 of the NATO treaty being bandied around:
The full wording from the North Atlantic Treaty reads: “The Parties agree that an armed attack against one or more of them in Europe or North America shall be considered an attack against them all and consequently they agree that, if such an armed attack occurs, each of them, in exercise of the right of individual or collective self-defence recognised by Article 51 of the Charter of the United Nations, will assist the Party or Parties so attacked by taking forthwith, individually and in concert with the other Parties, such action as it deems necessary, including the use of armed force, to restore and maintain the security of the North Atlantic area.”
This is why NATO countries are politely declining Trump’s invitation to join a war he started.
So why the calm?
The single biggest reason equities are holding up is that the earnings forecasts that underpin their prices are also stable. Even if energy companies (obviously helped by a big oil price increase) are excluded, the war has had no effect so far on rising earnings expectations for this year.
Earnings momentum as strong as this will limit the downside for a stock market. It’s likely that brokers are holding off on changing their estimates until there is more clarity on the duration of the conflict. If it goes on a few more weeks, it’s possible the market will have to deal with a raft of downgrades. But currently, bullish forecasts limit the downside and the damage.
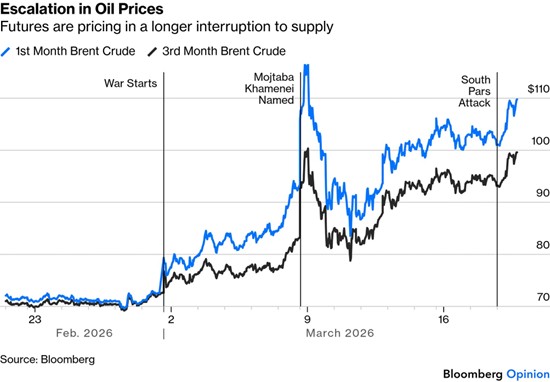
Warning: these are very early days. Escalations that could change the outlook: Extended closure of the Strait of Hormuz (no more storage space left, so production has to be stopped); targeting of said oil storage in the Gulf (100 million barrels – and filling up quickly); targeting of Kharg Island’s oil infrastructure (>90% of Iran Oil).
At the moment, the war is perceived to require a rise in the risk premium for stocks, but not a particularly big one. This comes out in the latest Bank of America survey of global fund managers, who say they’re now taking less risk than usual — but remain far less cautious than they were in 2022, or after the Liberation Day tariffs a year ago.
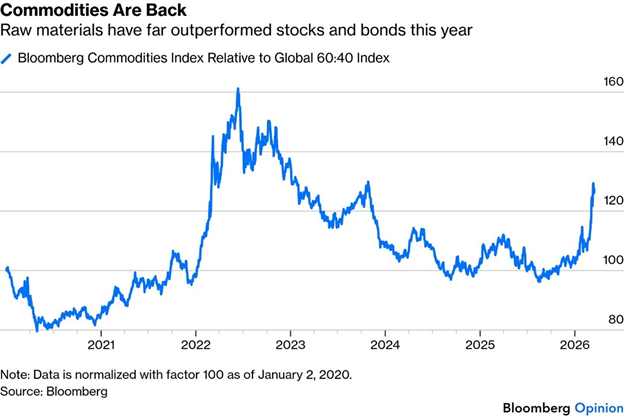
Bloomberg’s commodities index (including industrial and precious metals and agricultural crops as well as fuel) is beating stocks and bonds (represented by the Bloomberg 60:40 index) in the most impressive way since the 2022 invasion of Ukraine.
I think we all know by now that market prices are based on ‘feelings’ and not necessarily facts, but that uncomfortable truth doesn’t impact the reality. The futures market is a result of thousands of traders’ feelings/ guesses/educated guesses, and it is very interesting to watch, and look at retrospectively.
For example, the fund managers quizzed by BofA (Bank of America) expect crude to be at about $76 by the end of the year. Let’s put a pin in this and see what happens. In my opinion, this war is being run on the feelings of a highly impressionable octogenarian (who already has his sights on Cuba), and an extremely powerful pro-Israeli lobby with decades-long tradition, and breaking those bonds comes closer to treason in the US than many other actions that are actually treasonous.
Those predictions of $76 are not far out of line with the futures market, which is pricing Brent crude at just over $80 nine months hence. This is considered a ‘manageable’ shock by the markets; over $100 or higher (as it is now) would be (euphemistically) ‘less manageable’. The price of oil feeds back into every aspect of the economy and will impact inflation. Stagflation is now clearly back as the greatest risk on the horizon – but frankly, that underlying worry has been there for 4 years now. Yes, the threat has increased, but it hasn’t exactly come out of nowhere.

US consumers, more than any other country on earth, drive the economy, with up to 70% of GDP coming from consumer consumption (the UK is second at circa 60%). Affordability has been the word on everyone’s lips for the last year, and was Trump’s rallying cry during his election campaign. So far, he rates a solid F on that score (of course, it’s not his fault…). This war is 100% a Trump self-own.
Consumers aren’t catching a break any time soon if Trump’s shifting timelines on the war are any indication. Pain at the pump is getting worse, with the average gasoline price tracked by the American Automobile Association at its highest since 2023. It’s still well below the peaks seen after Russia invaded Ukraine, but the speed of the increase is fully comparable.
The key difference is the consumer backdrop.
In 2022, households were emerging from the pandemic flush with stimulus cash. They no longer have that cushion. Consumers are instead grappling with elevated borrowing costs, thinner savings, and little margin for another sustained increase in energy prices. Consumer spending barely rose in January, and economic growth was weaker than previously reported at the end of last year, suggesting a momentum loss even before the war started.
The average price of diesel has now risen above $5 per gallon, pushing up supply chain costs and setting the stage for broader inflation. The spike is hitting farmers, truckers and construction firms. With $5 (R21.50) diesel, industries must this week spend around $6.1 billion on fuel, compared to just $4.5 billion ahead of the war, a 35% increase. This is going to feed into inflation. (Did you know that in RSA, the petrol price is regulated but diesel is not?)
This is the very antithesis to affordability politics. The steady decline in gas prices since 2022 brought real gains. Spending on energy and services fell to 3.4% of disposable income in January. Outside the pandemic period, that’s arguably the lowest this century.
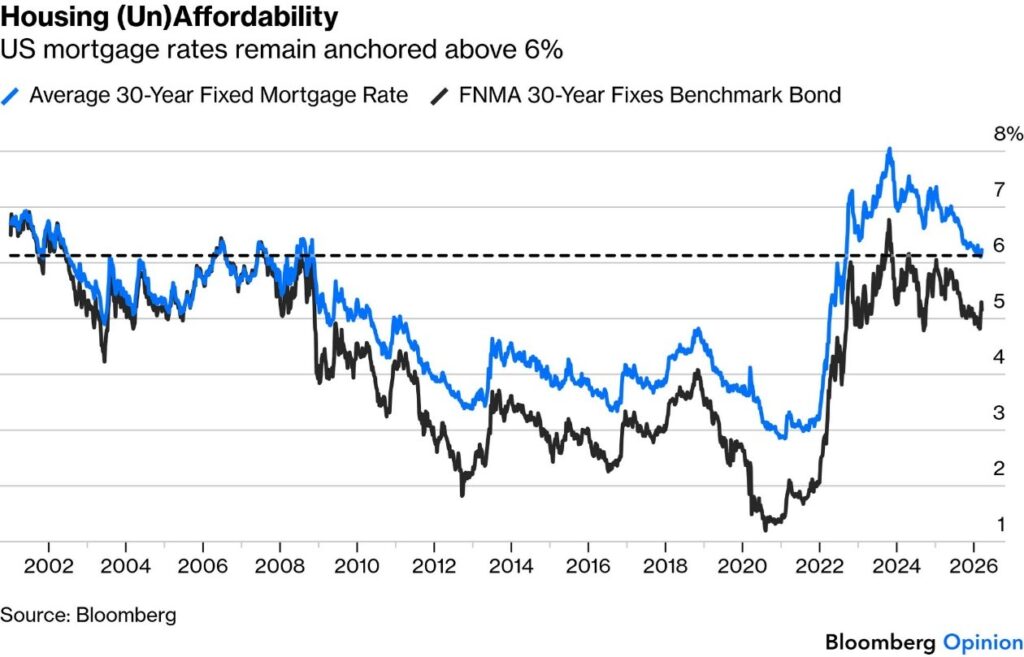
Beyond energy costs, pending home sales are another affordability measure whose rebound is now under threat. Most US mortgages are fixed-rate and linked to the 10-year treasury rate, which is now climbing back up. The graph below shows that Americans are having to get used to mortgage interest rates 3 times higher than they were before the pandemic, which was when we saw some of the lowest mortgage rates ever.
With affordability a key issue ahead of the November midterms, a swift resolution to the war is necessary for the administration, but it isn’t sufficient to ensure victory. Washington will require a meaningful reversal in these cost pressures. Otherwise, it’s hard to see voters looking past that issue that decided their vote in the last election.

RSA – how the oil shock will effect us
Next month we are going to get a nasty shock at the pump – a huge leap in price and a rand depreciation – Diarise to fill up before Wednesday, the first of April.
This increase in oil is unfortunately going to have an almost immediate effect on our inflation, and this is going to feed back into our interest rates.
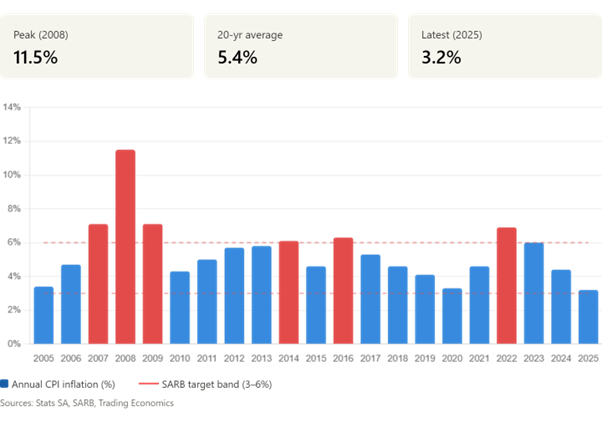
Key moments to note:
Most recently, the average inflation rate for 2025 was 3.2%, the lowest in 21 years (since 2004), partly reflecting the SARB’s tighter monetary policy and lower global commodity prices. This has now changed.

One of the emerging stories around AI and the massive capex spent on, among other things, data centres, is their consumption of electricity and water.
While electricity is ‘consumed’, the water isn’t, of course. Unlike the production of hydrogen for energy, where water is ‘split’ into one hydrogen molecule and two oxygen molecules, water in datacentres is used to cool and is transformed into vapour and released back into the air. (The ‘smoke’ you see coming out of cooling towers is also water vapour, ditto the contrails you see trailing jets.
At any given time, roughly 12,900 cubic kilometres of water vapour are present in Earth’s atmosphere — equivalent to about 1.29 × 10¹⁶ kilograms.
To put that in perspective: The atmosphere only holds 1 part in 2,500 of all the Earth’s fresh water, and 1 part in 100,000 of all water on Earth (oceans included). So, it’s a tiny sliver of the total, but an extraordinarily busy one. That ~12,900 km³ is approximately 7 times more than all the world’s rivers combined. This entire amount is recycled through evaporation roughly 40 times per year.
Over 99% of the atmospheric moisture is in the form of water vapour (the remainder is liquid droplets in clouds and fog). Tropical oceans and wet tropical areas have the most water vapour, while Arctic land areas and high-mountain regions have the least — because warm air holds far more water than cold air. Total atmospheric water vapour is increasing by 1 to 2% per decade, and for every degree Celsius that Earth’s temperature rises, the atmosphere holds more vapour still a self-reinforcing “warming” feedback loop.
Anyone who plays a computer game on their PC knows just how warm the device can get; multiply that by millions, and you have the datacentres with their rack-mounted servers. Fans just don’t cut it.
There 3 main ways these servers are cooled:
The UAE is one of the fastest-growing data centre hubs in the world, so obviously, the water consumption is a huge issue.
The UAE data centre market was valued at $1.26 billion in 2024 and is expected to reach $3.33 billion by 2030. There are around 35 existing colocation facilities, most of them in Dubai, and Dubai and Abu Dhabi dominate capacity.
The water problem is severe.
Data centres powering AI across the UAE and Saudi Arabia are projected to consume over 426 billion litres of water annually by 2030. This is a country that has essentially no rivers or natural freshwater lakes — almost all drinking water comes from energy-intensive desalination of seawater (some of which appear to have been bombed by Iran).
Operators are pursuing several strategies, increasingly moving away from the evaporative cooling towers described above. The most promising shift is to liquid cooling at the chip level. Liquid cooling is reported to slash data centre water use by up to 92%, and projects by Khazna, Datavolt, and Alfanar in the region are already deploying it. Cold plates and immersion cooling can reduce water usage by 31 to 52 percent over their entire life cycles compared to traditional approaches.
Microsoft’s two-phase immersion rollouts achieve zero water consumption in the cooling process itself — a significant milestone for an arid region.
For facilities that still use water, Khazna is piloting treated sewage effluent (recycled wastewater) rather than potable water for cooling.
At night, the desert climate actually helps, the world’s largest solar-powered data centre at Mohammed bin Rashid Al Maktoum Solar Park uses indirect free-cooling loops that exploit nighttime desert temperature drops (a full 15-20 degree change).
A creative idea: use waste heat for desalination
Perhaps the most elegant concept being explored is running the cooling loop in reverse. A single megawatt of data centre load can produce around 100 m³ of fresh water daily through waste-heat thermal desalination, meaning a large data centre could theoretically become a net producer of fresh water for the surrounding community, rather than a consumer. Recent studies have proposed integrating data centre cooling with low-temperature desalination units, and pilot projects are underway.
Efforts to mitigate water use remain limited across the Gulf, and few companies disclose detailed data on water or energy usage for their Gulf operations. There’s a real tension: the UAE’s sovereign wealth funds and government are betting heavily on becoming a global AI hub, and that ambition is colliding head-on with the country’s fundamental water constraints. The cooling technology exists to solve the problem; immersion and direct liquid cooling genuinely work, but cost and the pace of deployment at scale are the remaining challenges.

In financial markets, nothing matters more than the Fed. The Federal Open Market Committee met last Wednesday afternoon and left rates unchanged (as universally expected), with one dissent from the dovish Trump appointee Stephen Miran (who cannot take the chair until approved by Congress, and that might take a while, perhaps even past the midterms).
The governors updated their projections for the fed funds rate and the main economic indicators in the so-called dot plot — but we needn’t pay much attention, as the chairman, Jerome Powell, told us to ignore them.
Powell commented that several colleagues felt that if there were ever a time to skip the dot plot, this would be it. Too much depends on the extent and duration of the oil price shock.
Given that the FOMC did nothing and admitted it was as dependent on the news from the Middle East as the rest of us, there should be little reason for markets to move. That wasn’t what happened. As Powell spoke, equities sold off, and bond yields surged. He might be a few weeks away from the end of his term, but he is standing his ground – and markets are listening.
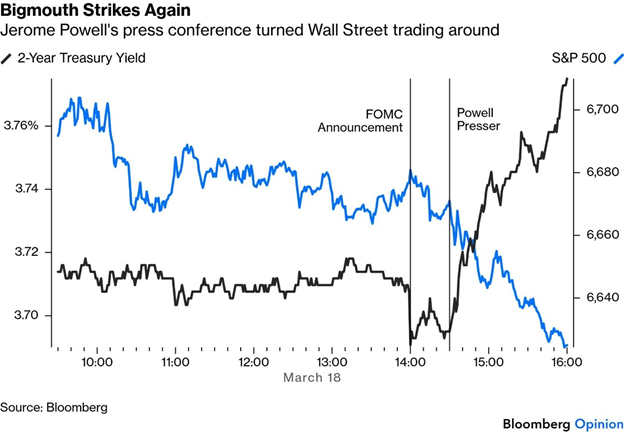
Why? Without saying anything explicitly hawkish, Powell made clear that he and his colleagues needed to know how the war would unfold. It wasn’t a dovish or hawkish hold; it was as non-committal a hold as they could muster, given radical uncertainty.
Critically, Powell updated his career plans, which we have speculated about in previous newsletters. If Kevin Warsh isn’t confirmed by the end of his term as chair, Powell said he will carry on as chairman pro tem. And as long as the government continues to prosecute him (an action already roundly criticised by a conservative federal judge), he will continue on the board of governors, where his term has two years to run. Once the prosecution is over, he said, he hasn’t decided whether he’ll carry on.
This gets to the heart of the battle over the Fed’s independence.
Powell has every right to protect his reputation and the integrity of the institution, and the prosecution is just bog-standard Trump retaliation. Staying on the board, the first chairman to do so since Marriner Eccles in the 1940s, would, however, ensure that the political battle over the central bank’s independence would continue. Warsh is seen as on a mission to reduce rates if at all possible, and Powell’s continued presence would make the political dynamics harder for markets to gauge. It might make a policy error less likely, but it would also help to fuel market confusion.
Powell could have said that he had decided to stay on. His non-committal stance merely shows that he wants to maintain his leverage in a fight against some unscrupulous opponents. But if he really were to stay on, trying to predict the FOMC would be a new and difficult game.
For now, the war has slashed hopes for rate cuts. On the eve of the Iran attack, fed funds futures priced three more cuts of 25 basis points in the next 18 months. That’s been cut to one.
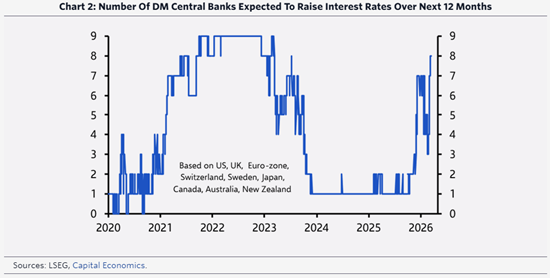
The Fed is a global outlier, as it’s still expected to cut. Each of the nine other largest developed market central banks is now forecast to hike, as this shows.

Even before the news from the Gulf and the FOMC, data gave cause for disquiet. Core producer price inflation is at a three-year high:
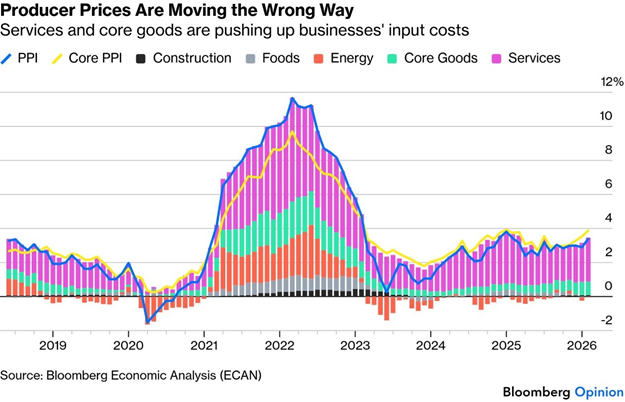
Tariffs are partly responsible. Their inflationary impact has been muted so far, but core goods prices (the most directly affected) have risen since Liberation Day. The war has taken everyone’s eye off the tariffs, recently struck down by the Supreme Court.
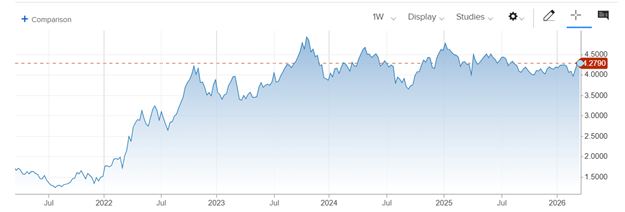
It wasn’t just gold that saw a surge in price last year; many other commodities saw a climb in price.
Author: Dawn Ridler

March 2026 held an unexpected surprise for long-term equity investors. No doubt, going into February, most investors would have seen the US military build-up in the Middle East whilst negotiations were ongoing. Most people would have viewed this as scaremongering not thinking that the US and Israel were trying to launch WW3. But looks can be deceiving, and all of this changed on 28 February as barrage after barrage of firepower was unleashed on Iran.
In markets, we would call this systematic risk, as diversifying away from this is actually quite difficult.
Much of the market reaction could have been contained if the outcomes of this war had been better studied or perhaps understood. The most obvious was that Iran could prohibit ships from sailing through the Strait of Hormuz, all carrying the livelihood of the world economy, oil. Even though we have been talking about this threat in these newsletters and on the podcast for months, if not years. We now know that not much thought was given to this, or perhaps the US and Israel viewed the problem with a large dollop of hubris, which is now coming back to bite them. So, whilst you watch the Iranians promise havoc in the territory and the US vowing that they have the situation under control, markets are falling and are most acutely felt in emerging market assets such as South Africa.
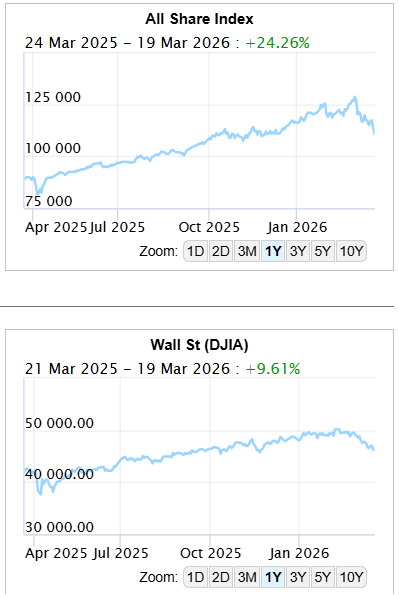
This month, the JSE All Share index has fallen by 13.8% driven by Resources which are down -24% in the month.
These are large numbers. Financials are down 10% whereas Industrials have contracted by -5.8%. So why are SA Resources, which are heavily weighted to Gold, down so much ? Surely they should go up in times of trouble? Well, the US Dollar has strengthened as capital leaves equity markets, and the currency, despite all of the rhetoric surrounding it losing reserve currency status, still seems to be the obvious choice for parking cash during times of uncertainty.
Resources are priced in US dollars, and a stronger Dollar means lower margins for miners. Add to this market volatility, which is exacerbated as margin calls force prices lower, and oil takes away some of the trade which exclusively belonged to metals before.
So the first thing the market needs is some certainty around the future of this war. At the moment, there is a lot of rhetoric but no clear plan.
This is the opportunity. We have been active towards the latter part of the week, purchasing equities at lower valuations. But to do this requires looking through the current crisis to a time when sense prevails. This is coming, but by then the opportunity presented today will also be gone. In order to help us with this framework, we ask a simple question. Where will the world be in a year from now?
The US and Europe will still be indebted, and as a matter of fact, the US would have piled on even more debt due to their Middle East adventure (already asking Congress for another $200bn). These nations will still need monetisation, with investors requiring alternatives to cheaper currencies. The inflation rate will probably end somewhere in the territory it is today and rates will stay constant as the world digests a higher oil price.
There is now a premium on oil, and the war has ruptured the free trade of it. I foresee a future where oil producers choose with whom they are aligned and the prices they pay will be different to non-aligned members. This has already started happening with sanctioned Iranian and Russian oil being shipped to China. I foresee more of this keeping oil prices more elevated. Peace, or at least a truce, has to happen in the Middle East and will probably be driven by those who didn’t join the conflict. Until then, market volatility can be a buying opportunity, but looking through the noise is critical.
Author Cobie Le Grange
EXCHANGE RATES and other Indices:
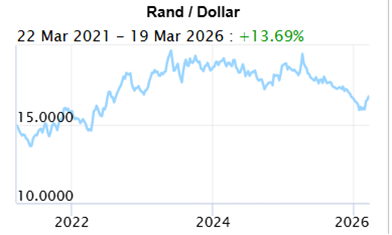
The Rand/Dollar closed at R17.06 (R16.89, R16.55, R15.93, R16.01, R15.96, R16,03, R16.15, R16.10, R16.50, …R16.91, R17.13, R17.36, R17.13, R17.27, R17.31, R17.25, R17.38, R17.50, R17.22 , R17.35, R17.33, R17.37, R17.58, R17.65, R17.44, R17.61, R17.74, R18.15,R17.76, R17.72, R17.90, R17.58, R17.89, R17.99, R17.92, R17.77, R17.95, R17.88)
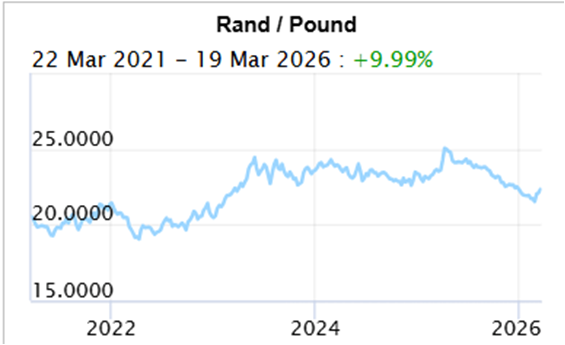
The Rand/Pound closed at R22.76 (R22.35, R22.20, R21.48, R21.59, R21.78, R21,82, R22.11, R21.97, R22.13, …R22.57, R22.68, R22.74, R22.56, R22.69, R22.76, R22.96, R23.34, R23.37, R23.19, R23.22, R23.35, R23.55, R23.73, R23.84, R23.53, R23.84, R23.84, R24.09, R23.88, R23.76, R24.22, R24.08, R24.49, R24.22, R24.35, R24.05, R24.18)
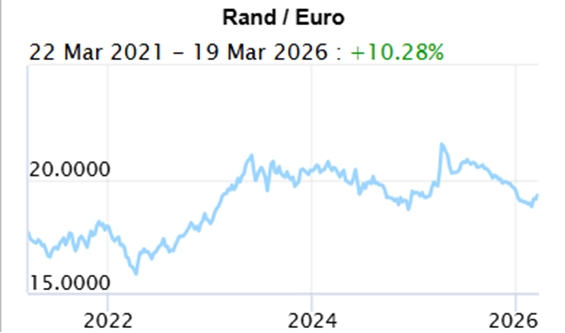
The Rand/Euro closed the week at R19.77 (R19.33, R19.23, R18.80, R18.87, R18.94, R18.93, R19.14, R19.04, R19.20, …R19.68, R19.86, R19.99, R19.96, R19.98, R20.02, R20.06, R20.26, R20.33, R 20.22, R20.30, R20.35, R20.38, R20.61, R20.62, R20.44, R20.56, R20.64, R21.04, R20.86, R20.61, R20.93, R 20.70, R20.91, R20.74, R20.68, R20.24, R20,37)
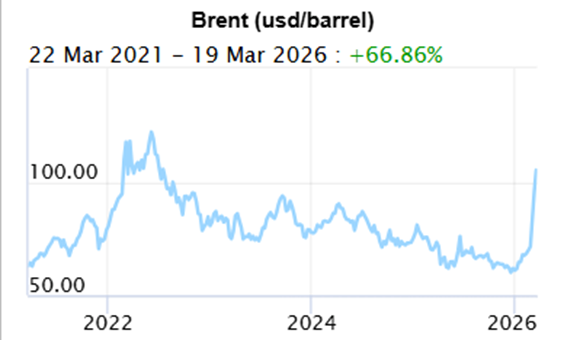
Brent Crude: Closed the week $112.36 ($103.14, $92.88, $73.19, $71.76, $67.75, $68,05, $69.32, $65.88, $63.34, …$63.71, $63.19, $62.42, $63.94, $63.61 $64.66, $65.04, $61.27, $62.14, $64.28, $69.67, $66.57, $66.80, $65.52, $67.38, $67.73, $66.08, $66.07, $69.46, $68.29, $69.21, $70.58, $68.27, $67.39, $77.27, $74.38, $66.56, $62.61, $65.41)
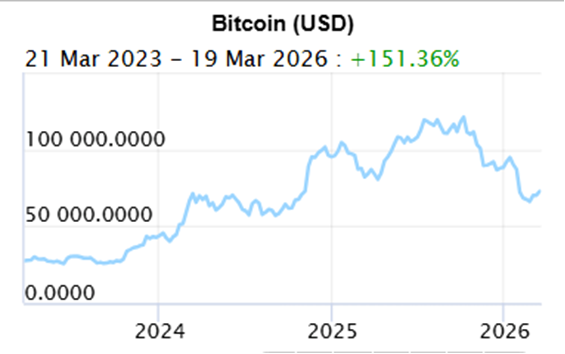
Bitcoin closed at $68,586 ($70,869, $67,310, $63,534, $68,04, $69,649, $68,553, $81,301, $89,295, $90,585, … $90,809, $86,334, $94,990, $101,562, $109.936, $112,492, $106,849, $111,888, $124,858, $109,446, $115,838, $115,770, $110,752, $108,923, $114,916, $117,371, $118,043, $113,608, $118,139, $118,214, $117,871, $108,056, $107,461, $103,455)
Articles and Blogs:
Dos and Don’ts of Wills and Estate Planning NEW
Planning your legacy, starting with your will NEW
Holiday checklist
Next year – Action Plan
Next year – Vision, Mission etc
Medical Risk Mitigation
Next Year – Consolidation
Abdication or diversification?
Carbo-loading your retirement Spoiled for choice
Who needs a plan anyway
8 questions you need to ask about retirement
What to do when interest rates drop
How to survive volatility in your investments
What to do when interest rates drop
Difficult Financial Conversations
Financial Implications of Longevity
Kick Start Your Own Retirement Plan
You matter more than your kids in retirement
To catch a falling knife
Income at retirement
2025 Budget
Apportioning blame for your financial state
Tempering fear and greed
New Year’s resolutions over? Try a Wealth Bingo Card instead.
Wills and Estate Planning (comprehensive 3 in one post)
Pre-retirement – The make-or-break moments
Some unconventional thoughts on wealth and risk management
Wealth creation is a balancing act over time
Wealth traps waiting for unsuspecting entrepreneurs
Two Pot pension system demystified
Cobie Legrange and Dawn Ridler,
Rexsolom Invest, Licensed FSP 45521.
Email: cobie@rexsolom.co.za, dawn@rexsolom.co.za
Website: rexsolom.co.za, wealthecology.co.za